


¡Nuestro equipo cuenta con más de 7,000,000 operadores!
Cada día, trabajamos juntos para mejorar las operaciones. Obtenemos grandes resultados y seguimos adelante.
El reconocimiento de millones de operadores en todo el mundo es el mejor agradecimiento a nuestro trabajo! ¡Usted hizo su elección y haremos todo lo que esté a nuestro alcance para satisfacer sus expectativas!
¡Juntos somos un gran equipo!
InstaSpot. ¡Orgulloso de trabajar para usted!


¡Actor, 6 veces ganador del torneo UFC y un verdadero héroe!
El hombre que se hizo a sí mismo. El hombre que sigue nuestro camino.
El secreto detrás del éxito de Taktarov es el constante movimiento hacia el objetivo.
¡Revele todo los lados de su talento!
Descubra, intente, fracase, ¡pero nunca se rinda!
InstaSpot. ¡Su historia de éxito comienza aquí!
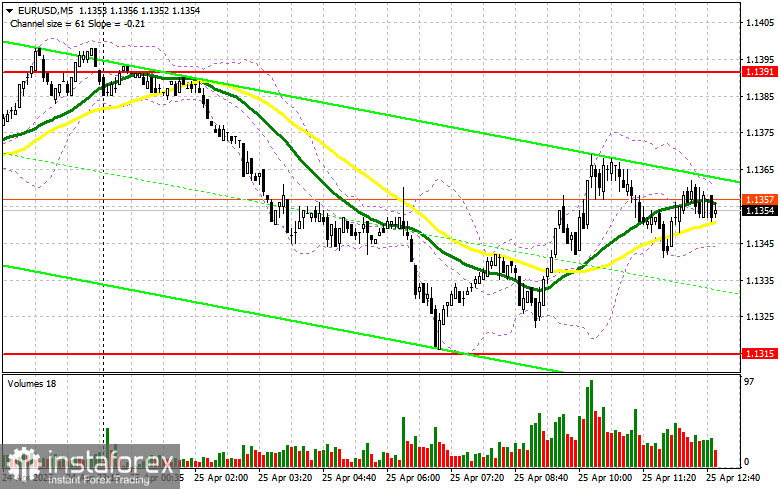
In my morning forecast, I focused on the 1.1391 level and planned to make entry decisions around it. Let's take a look at the 5-minute chart and assess what happened. The pair did rise, but it never reached the 1.1391 test level, so no trades were executed. The technical outlook for the second half of the day remains unchanged.
To Open Long Positions on EUR/USD:
The euro failed to gain support amid a lack of statistical data and remained within a sideways channel. In the second half of the day, only the University of Michigan Consumer Sentiment Index and inflation expectations are scheduled for release—nothing else of importance—so I wouldn't expect significant movement. Only a major deviation from forecasts would cause a spike in volatility.
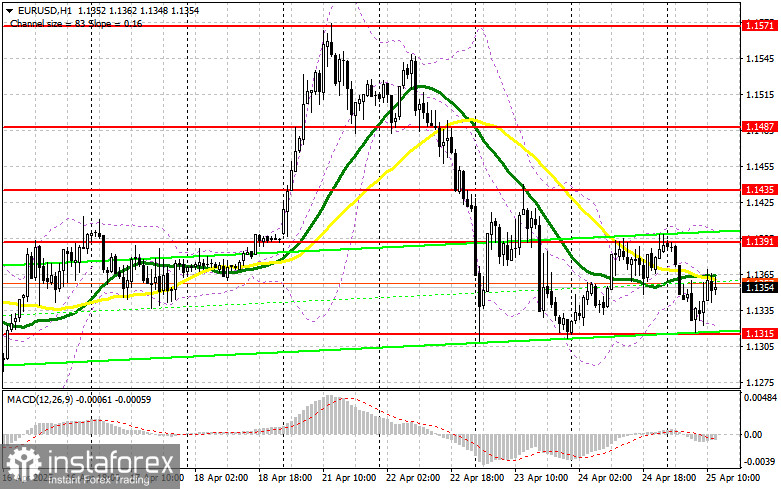
Only very strong data could bring back pressure on EUR/USD, which I intend to use as an entry opportunity. In case of a decline, a false breakout near the new support at 1.1315 would be a reason to buy EUR/USD, targeting a continuation of the bullish market with a view to update 1.1391. A breakout and retest of this range from above would confirm a valid long-entry point, pushing the pair toward 1.1435. The ultimate target remains 1.1487, where I plan to take profit.
If EUR/USD drops and there's no activity around 1.1315, the pair will exit the sideways channel, likely triggering a sharper downward movement. In that case, bears could drag it down to 1.1267. Only after a false breakout forms there would I consider buying the euro. Otherwise, I plan to open long positions on a rebound from 1.1206, targeting a 30–35 point intraday correction.
To Open Short Positions on EUR/USD:
If the euro rises after the U.S. data, bears will need to prove themselves near 1.1391—a level the pair failed to reach in the first half of the day. Just below are the moving averages, which currently favor sellers. Only a false breakout at that level will offer a short-entry opportunity targeting the 1.1315 support formed earlier today. A breakout and consolidation below this range would signal a good selling opportunity with a move toward 1.1267—already a significant correction. The final target would be 1.1206, where I plan to take profit. A test of this level would break the current bullish market.
If EUR/USD moves higher in the second half of the day and bears do not act near 1.1391, buyers could push the pair toward 1.1435. I will only sell after a failed consolidation at that level. If there's no downside momentum there either, I'll look for a short entry on a rebound from 1.1487 with a target of a 30–35 point downward correction.
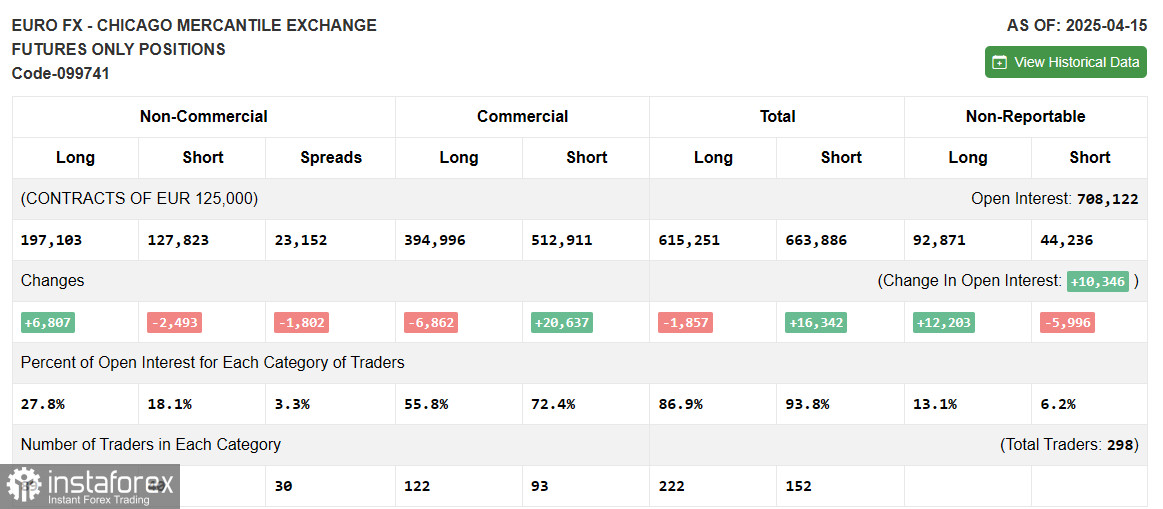
In the COT (Commitment of Traders) report from April 15, there was a rise in long positions and a reduction in shorts. Considering that the EU and the U.S. have yet to reach a trade agreement, the euro continues to strengthen while the dollar weakens. Ongoing concerns over Trump's attempts to remove Fed Chair Jerome Powell also continue to pressure the dollar.
The report shows that long non-commercial positions rose by 6,807 to 197,103, while short positions fell by 2,493 to 127,823. As a result, the gap between long and short positions narrowed by 2,493.
Indicator Signals:
Moving Averages Trading is taking place near the 30- and 50-day moving averages, indicating market indecision.
Note: The author evaluates moving averages based on the hourly H1 chart, which differs from the standard daily D1 chart view.
Bollinger Bands In the event of a decline, the lower boundary of the indicator at 1.1315 will act as support.
Indicator Descriptions:
*El análisis de mercado publicado aquí tiene la finalidad de incrementar su conocimiento, más no darle instrucciones para realizar una operación.
¡Los informes analíticos de InstaSpot lo mantendrá bien informado de las tendencias del mercado! Al ser un cliente de InstaSpot, se le proporciona una gran cantidad de servicios gratuitos para una operación eficiente.


