


¡Nuestro equipo cuenta con más de 7,000,000 operadores!
Cada día, trabajamos juntos para mejorar las operaciones. Obtenemos grandes resultados y seguimos adelante.
El reconocimiento de millones de operadores en todo el mundo es el mejor agradecimiento a nuestro trabajo! ¡Usted hizo su elección y haremos todo lo que esté a nuestro alcance para satisfacer sus expectativas!
¡Juntos somos un gran equipo!
InstaSpot. ¡Orgulloso de trabajar para usted!


¡Actor, 6 veces ganador del torneo UFC y un verdadero héroe!
El hombre que se hizo a sí mismo. El hombre que sigue nuestro camino.
El secreto detrás del éxito de Taktarov es el constante movimiento hacia el objetivo.
¡Revele todo los lados de su talento!
Descubra, intente, fracase, ¡pero nunca se rinda!
InstaSpot. ¡Su historia de éxito comienza aquí!
In my morning forecast, I drew attention to the 1.3304 level and planned to make market entry decisions from it. Let's look at the 5-minute chart and analyze what happened. A rise and false breakout around 1.3304 provided an entry point for short positions, but the pair didn't experience a significant drop. The technical outlook was adjusted for the second half of the day.
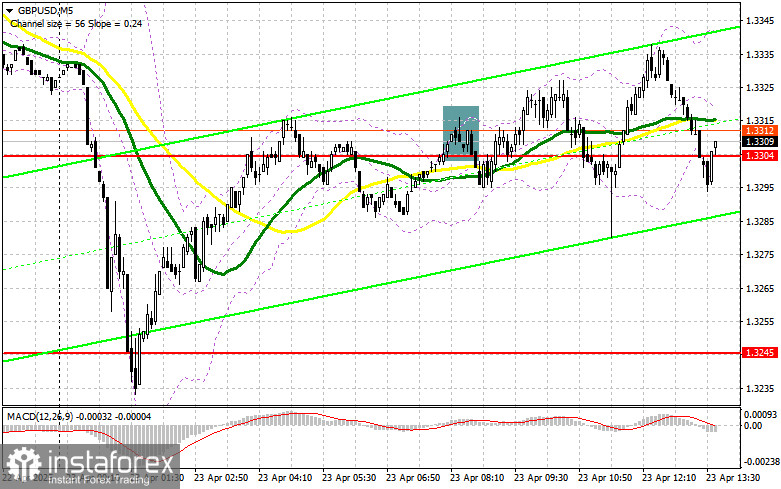
Weak UK services PMI data for April pressured the pound but wasn't enough to push the pair even to the daily low. During the US session, bulls will have to rely on similarly weak data from the United States. PMI figures for the manufacturing and services sectors, as well as the composite index for April, are expected. In addition, speeches from FOMC members Austan D. Goolsbee and Christopher Waller are scheduled.
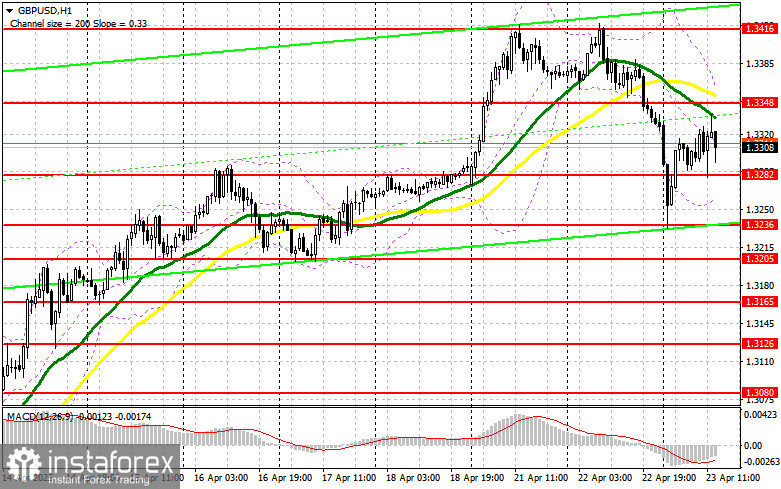
If the pair falls, I plan to act after a false breakout near the new support level at 1.3282, formed during the first half of the day. This will offer a good entry point for long positions, with the goal of recovering to the resistance at 1.3348—which has already proven difficult to break. Only a breakout and retest of this range from top to bottom will signal a new entry point for long positions, targeting an update of 1.3416, helping restore the bullish trend. The furthest target will be 1.3462, where I will take profit.
If GBP/USD declines and bulls fail to show activity at 1.3282 in the second half of the day, pressure on the pair will increase. In that case, only a false breakout around 1.3236 would be a suitable signal to open long positions. I plan to buy GBP/USD on a rebound from the 1.3205 support area, aiming for a 30–35 point intraday correction.
Sellers made an appearance but weren't as strong as needed. Only a hawkish tone from Fed speakers and strong US PMI figures will help bears regain control. If the pound makes another upward move in the second half of the day, I will act around the 1.3348 resistance area, where the moving averages also pass, supporting sellers. A false breakout there will offer a short entry point, aiming for a decline toward the 1.3282 support.
A breakout and upward retest of that range would trigger stop-loss orders and open the path to 1.3236. The ultimate target will be 1.3205, where I plan to take profit. If demand for the pound returns in the second half of the day and bears remain inactive at 1.3348, it's best to delay shorts until the 1.3416 resistance—this week's high—is tested. I will only open short positions there on a false breakout. If there is no downward movement even there, I will look for short entries on a rebound from 1.3462, with a view to a 30–35 point correction.
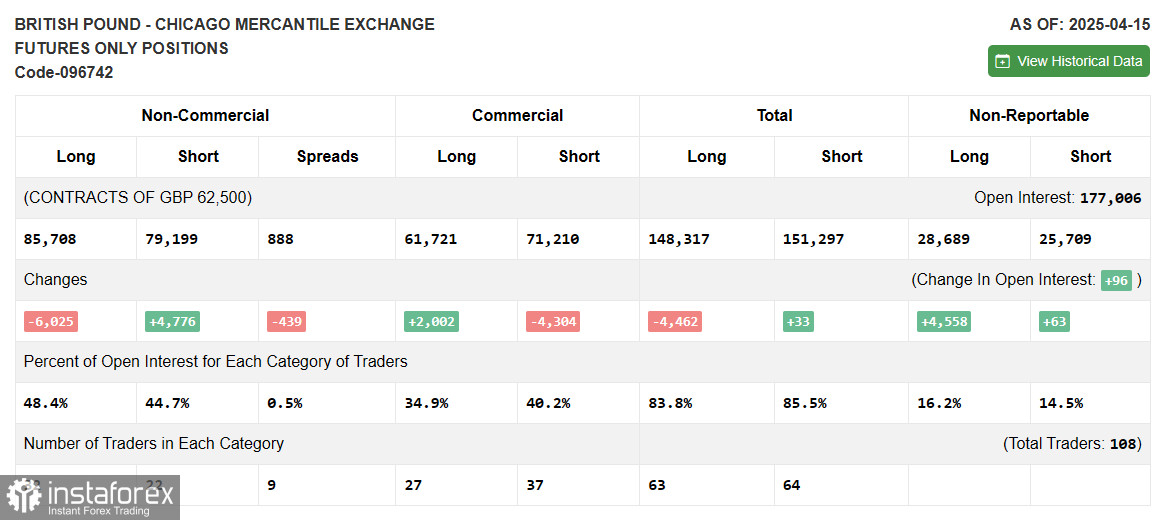
The latest COT report showed an increase in short positions and a decrease in long ones. Interestingly, the pound continues to rise confidently against the dollar despite this data. However, this report is lagging, and the recent GBP/USD rally is directly linked to Trump's tariff policy and dissatisfaction with Fed Chair Jerome Powell's performance—factors that weigh more on the dollar than support the pound. The latest report shows that long non-commercial positions fell by 6,025 to 85,708, while short non-commercial positions rose by 4,776 to 79,199. As a result, the gap between long and short positions narrowed by 439.
Moving Averages Trading is occurring below the 30- and 50-period moving averages, which indicates a potential decline.
Note: The moving average periods and levels are based on the author's analysis on the H1 chart and may differ from traditional daily moving averages on the D1 chart.
Bollinger Bands If the pair falls, the lower boundary of the indicator near 1.3270 will serve as support.
*El análisis de mercado publicado aquí tiene la finalidad de incrementar su conocimiento, más no darle instrucciones para realizar una operación.
¡Los informes analíticos de InstaSpot lo mantendrá bien informado de las tendencias del mercado! Al ser un cliente de InstaSpot, se le proporciona una gran cantidad de servicios gratuitos para una operación eficiente.


