


¡La leyenda en el equipo de InstaSpot!
¡Leyenda! ¿Cree que es una retórica grandilocuente? Pero, ¿cómo deberíamos llamar a un hombre, que se convirtió en el primer asiático en ganar el campeonato mundial de ajedrez júnior a los 18 años y en el primer Gran Maestro indio a los 19 años? Ese fue el comienzo de un camino difícil hacia el título de Campeón del Mundo para Viswanathan Anand, el hombre que se convirtió en parte de la historia del ajedrez para siempre. ¡Ahora una leyenda más en el equipo de InstaSpot!


Borussia es uno de los clubes de fútbol con más títulos en Alemania, que ha demostrado repetidamente a los fanáticos: el espíritu de competencia y liderazgo que ciertamente conducirán al éxito. Opere de la misma manera que los profesionales del deporte: con confianza y de forma activa. ¡Mantenga un "pase" del Borussia FC y lidere con InstaSpot!
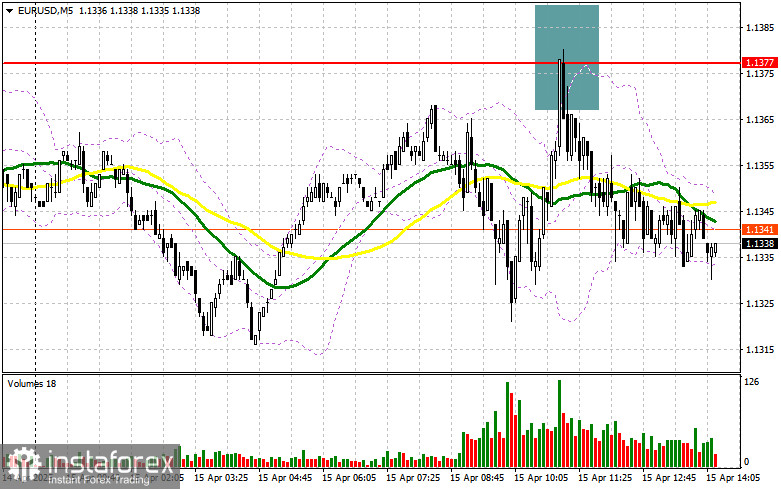
In my morning forecast, I highlighted the 1.1377 level and planned to make trading decisions from there. Let's look at the 5-minute chart and break down what happened. A rise followed by a false breakout near 1.1377 provided a good entry point for selling the euro, which led to a 40-point drop in the pair. The technical picture was not revised for the second half of the day.
To open long positions on EUR/USD:
Weak IFO data from Germany and the Eurozone disappointed traders and prevented EUR/USD from continuing its growth. However, no large-scale sell-off occurred either, indicating a presence of buyers — only time is needed for a new upward wave. In the second half of the day, we await U.S. data on the Empire State Manufacturing Index and Import Price Index. Only very strong figures are likely to trigger demand for the dollar.
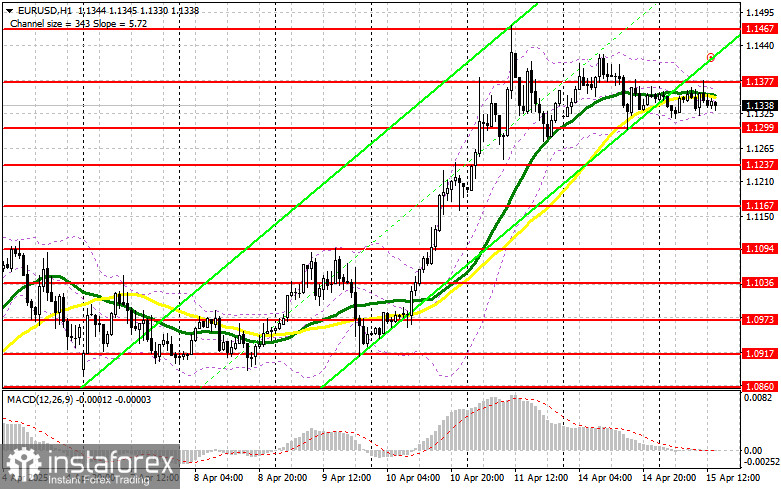
I will act similarly to the first half of the day. In the event of good U.S. data (which is unlikely), pressure on the euro will return. However, only a false breakout around the 1.1299 support will be a signal to buy EUR/USD, targeting a continuation of the bullish trend and a retest of 1.1377 — a level that couldn't be broken in the morning session. A breakout and retest from above would confirm a new long entry, with a potential move to 1.1467 — the yearly high. The final target is 1.1562, where I plan to take profit.
If EUR/USD falls and there is no bullish activity around 1.1299, pressure on the euro will increase. In this case, bears may push the pair down to 1.1237. Only after forming a false breakout there will I consider long positions. I will also look to buy from a rebound at 1.1167, targeting a 30–35 point intraday correction.
To open short positions on EUR/USD:
If U.S. data disappoints and no statements are expected from Fed officials today, then a false breakout near 1.1377 — as described above — will be enough to re-enter short positions, aiming for a decline toward the 1.1299 support. A breakout and consolidation below this area would open the way to 1.1237. The final target is 1.1167, where I plan to take profit.
If EUR/USD rises again in the second half of the day and bears remain inactive around 1.1377 — where moving averages are also clustered — bulls could drive the pair back to last week's highs. In this case, I will postpone selling until a test of the next resistance at 1.1467 and only enter short after a failed consolidation. If there's no pullback even there, I'll look for short entries from 1.1562 based on a 30–35 point intraday correction.
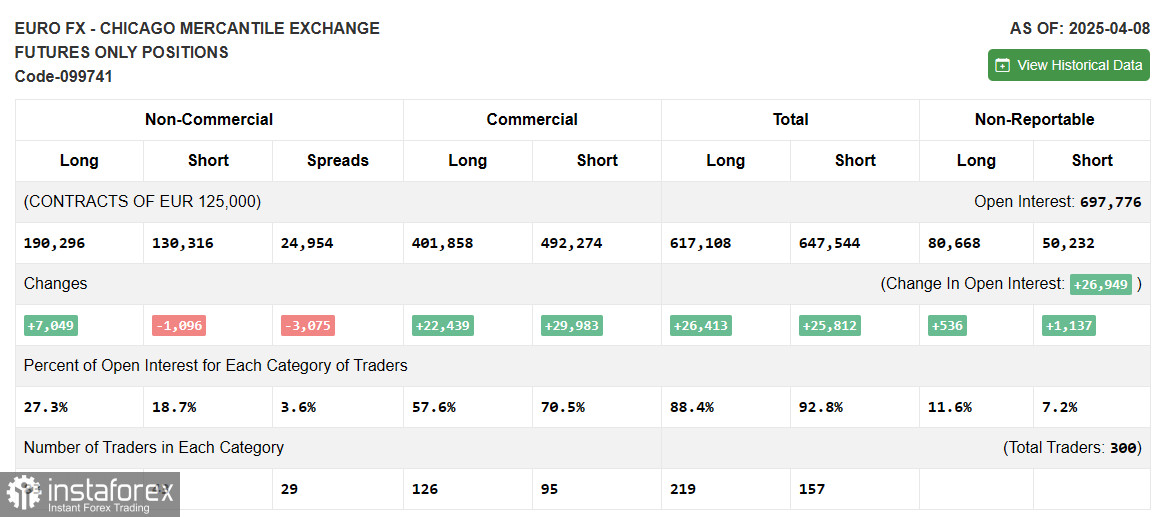
The COT report (Commitments of Traders) for April 8 showed an increase in long positions and a decrease in short ones. Given Trump's 90-day tariff freeze, the euro resumed its upward trend, as reflected by the growth in long positions. Additionally, fundamental data on declining inflation in the Eurozone boosted euro demand, as markets anticipate more aggressive action from the ECB to support the economy.
According to the COT report, long non-commercial positions increased by 7,049 to 190,296 and short non-commercial positions decreased by 1,096 to 130,316. As a result, the net long position widened by 2,466.
Indicator Signals
Moving Averages Trading is occurring near the 30- and 50-period moving averages, indicating a sideways market.
Note: The author refers to H1 chart moving averages, which differ from the traditional daily MAs on the D1 chart.
Bollinger Bands The lower band around 1.1324 will act as support in case of a decline.
Indicator Descriptions:
*El análisis de mercado publicado aquí tiene la finalidad de incrementar su conocimiento, más no darle instrucciones para realizar una operación.
¡Los informes analíticos de InstaSpot lo mantendrá bien informado de las tendencias del mercado! Al ser un cliente de InstaSpot, se le proporciona una gran cantidad de servicios gratuitos para una operación eficiente.


