


Since February 3 of this year, the chart of the euro has been forming an upward wave zigzag. The wave structure analysis indicates that a correction is forming in the final part (C), shaping a shifting flat pattern on the chart. This formation is nearing completion, with the price approaching the upper boundary of a strong potential reversal zone.
Throughout the upcoming week, the price is expected to move within a sideways range between the nearest opposing zones. A bullish vector is more likely in the first few days, but by the weekend, the probability of a reversal and a decline toward support levels increases.
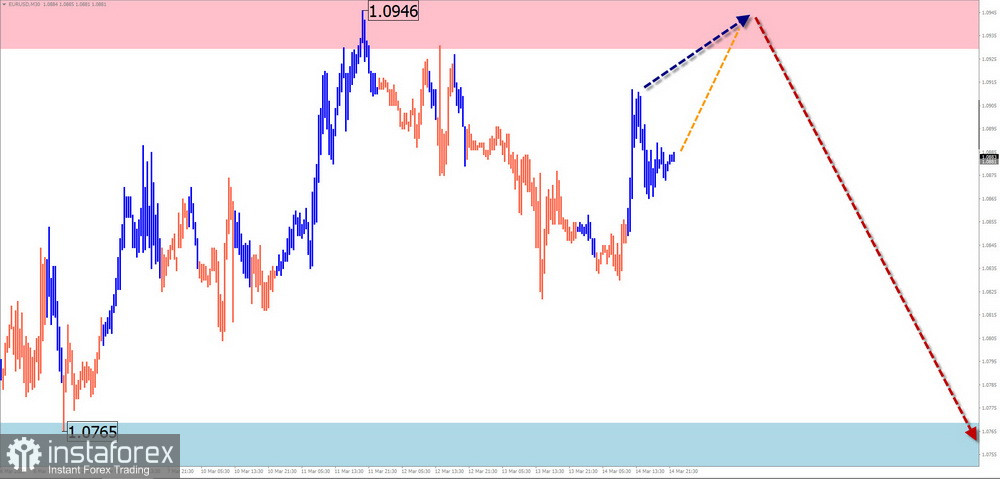
Resistance:
Support:
USD/JPY
Since July of last year, the Japanese yen has been strengthening against the U.S. dollar. Within this bearish wave structure, the final phase of wave (C) has been forming since the end of last year. Within this wave, the corrective part (B) is nearing completion, shaping a shifting flat pattern on the chart. Over the past two weeks, the price has been moving along the lower boundary of a strong weekly resistance zone.
Next week, USD/JPY is expected to remain in a sideways range. After possible pressure on the support zone, a reversal and a resumption of upward movement toward resistance levels may follow.
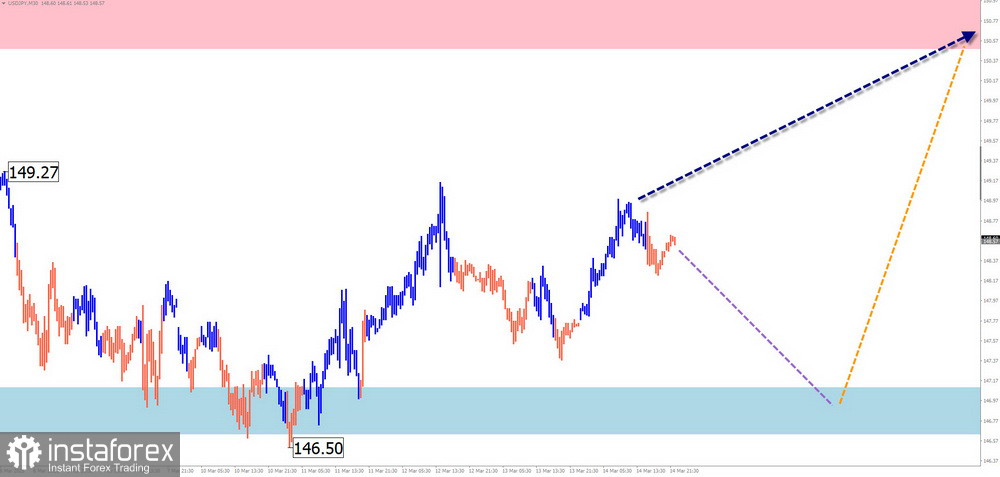
Resistance:
Support:
GBP/JPY
The GBP/JPY pair remains in a global bullish trend. Since August of last year, an ongoing corrective wave zigzag has been developing. The sideways movement of the past three months represents an intermediate correction (B). Once completed, the pair's growth is expected to resume.
At the beginning of the week, GBP/JPY is likely to move sideways, possibly declining toward support and testing its lower boundary. A trend reversal and a subsequent price increase are expected, accompanied by higher volatility. A breakout above the calculated resistance level is unlikely this week.
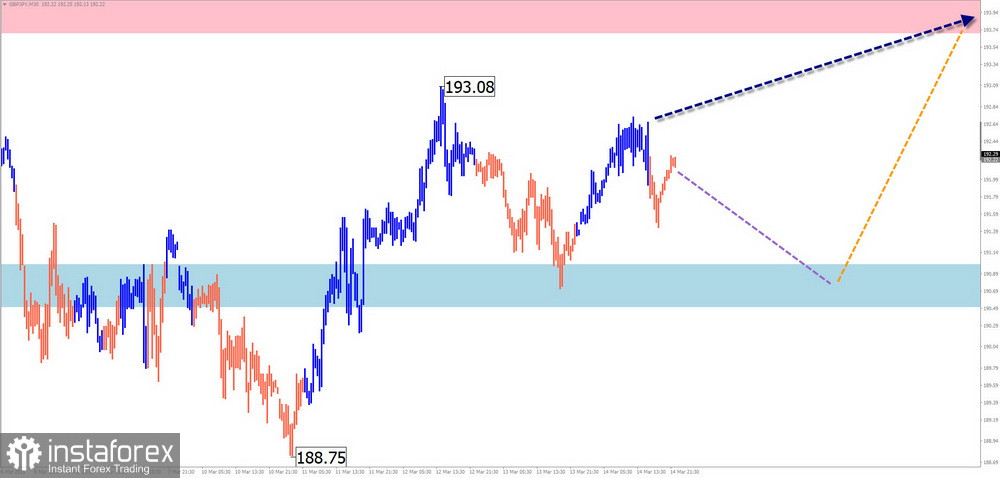
Resistance:
Support:
USD/CAD
Since February 3, the short-term trend for USD/CAD has been driven by a downward wave. Within this wave, the intermediate corrective phase (B) is nearing completion. The pair is currently trading within a channel between key potential reversal zones, and no clear signs of an imminent trend reversal are visible on the chart.
In the coming days, the price is likely to decline toward the support zone. A stalling movement and reversal conditions may emerge within the support zone. A break below the lower boundary of the projected support zone cannot be ruled out. However, a resumption of price growth is expected closer to the weekend.
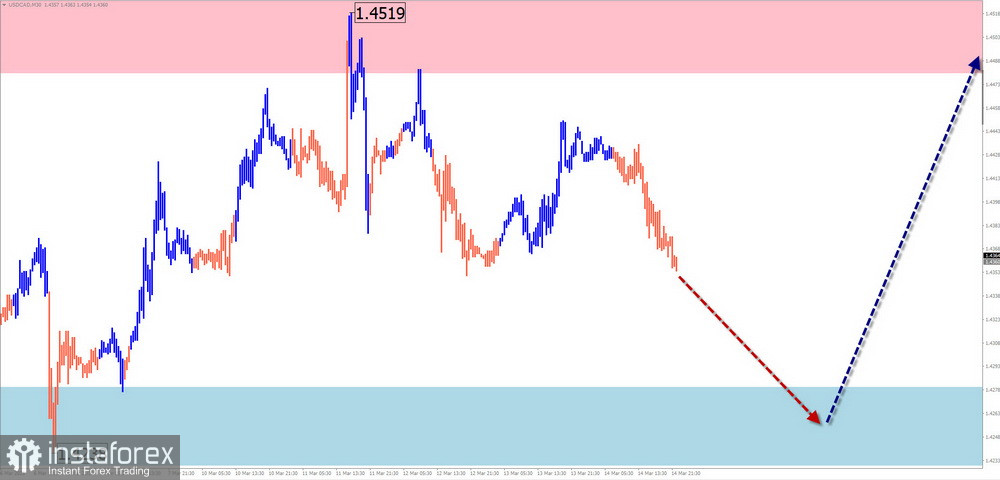
Resistance:
Support:
#Bitcoin
Since December of last year, Bitcoin has been forming a downward wave. The final part (C) is currently unfolding. The past two weeks have seen a temporary correction, which is nearing completion. Bitcoin's price is now at the upper boundary of a potential reversal zone, but no clear reversal signals have emerged yet.
Next week, Bitcoin is expected to complete its current rally, followed by a trend reversal and renewed price decline. During the trend shift, a short-term breach of the upper boundary of the projected resistance zone is possible.
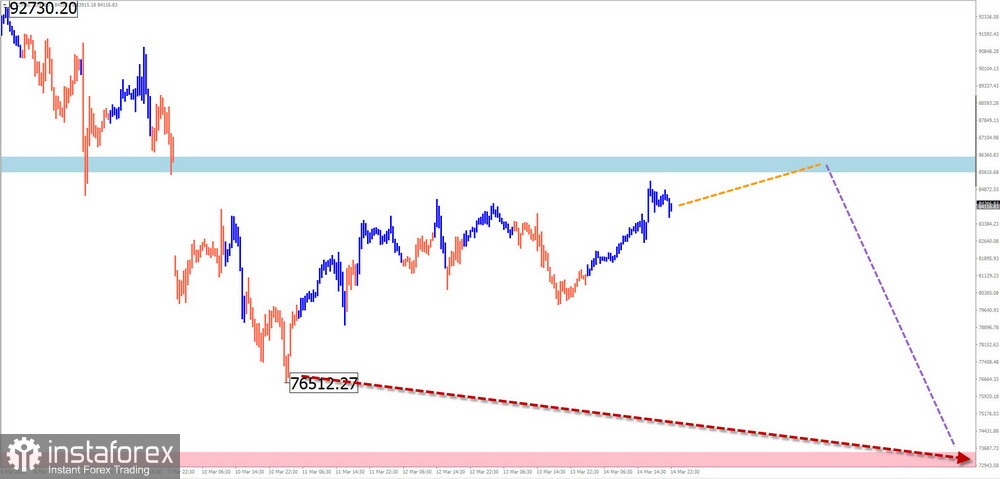
Resistance:
Support:
#Ripple
Since mid-January, XRP (Ripple) has been following a downward wave. The wave's highs and lows form a descending pennant pattern. Over the past two weeks, the intermediate phase of the wave has been developing, but it remains unfinished. Currently, XRP is near a key potential reversal zone on the daily chart.
At the beginning of the week, XRP's upward movement is likely to continue. However, near the calculated resistance zone, the likelihood of a pause and transition into a sideways drift increases sharply. Toward the end of the week, a trend reversal and a return to support levels are expected.
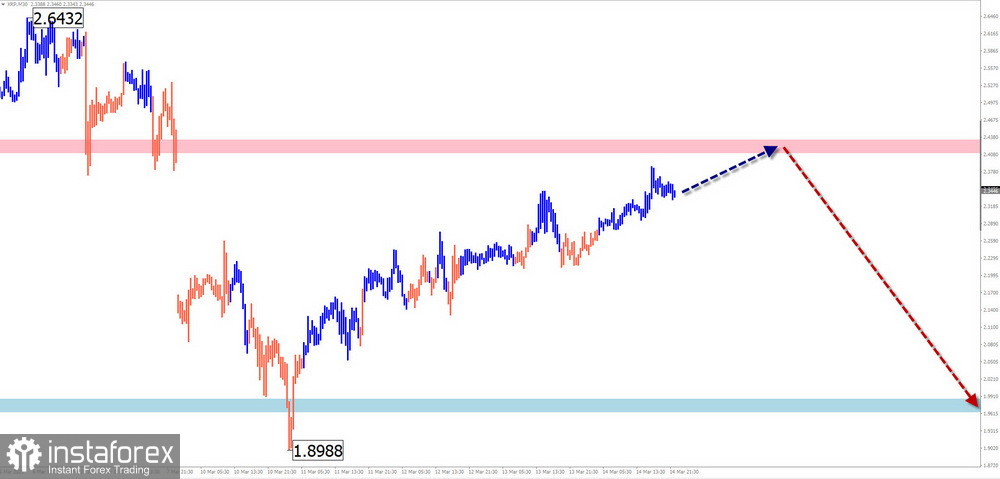
Resistance:
Support:
Explanation of Simplified Wave Analysis (SWA):
All waves consist of three parts (A-B-C). Only the last unfinished wave is analyzed on each timeframe. Dashed lines indicate expected price movements.
*El análisis de mercado publicado aquí tiene la finalidad de incrementar su conocimiento, más no darle instrucciones para realizar una operación.
¡Los informes analíticos de InstaSpot lo mantendrá bien informado de las tendencias del mercado! Al ser un cliente de InstaSpot, se le proporciona una gran cantidad de servicios gratuitos para una operación eficiente.


