


¡Nuestro equipo cuenta con más de 7,000,000 operadores!
Cada día, trabajamos juntos para mejorar las operaciones. Obtenemos grandes resultados y seguimos adelante.
El reconocimiento de millones de operadores en todo el mundo es el mejor agradecimiento a nuestro trabajo! ¡Usted hizo su elección y haremos todo lo que esté a nuestro alcance para satisfacer sus expectativas!
¡Juntos somos un gran equipo!
InstaSpot. ¡Orgulloso de trabajar para usted!


¡Actor, 6 veces ganador del torneo UFC y un verdadero héroe!
El hombre que se hizo a sí mismo. El hombre que sigue nuestro camino.
El secreto detrás del éxito de Taktarov es el constante movimiento hacia el objetivo.
¡Revele todo los lados de su talento!
Descubra, intente, fracase, ¡pero nunca se rinda!
InstaSpot. ¡Su historia de éxito comienza aquí!
Bitcoin and Ethereum have resumed their downtrend, as confirmed by ETF data showing another significant capital outflow. At the time of writing, Bitcoin has bounced off the $80,000 level and is trading around $82,000. Ethereum also dropped to the $2,000 area during Asian trading, but the move was quickly bought up, leading to a recovery to $2,063.

The lack of positive statements following Donald Trump's speech at Friday's cryptocurrency conference contributed to the protracted bearish trend.
The net outflow from spot BTC ETFs declined over the past trading week, shrinking to $739.2 million, compared to $2.614 billion the previous week. This suggests reduced selling pressure on Bitcoin and potential investor sentiment stabilization.
A similar trend is observed in spot ETH ETFs, where net outflows also decreased to $93.9 million from $335.5 million the previous week. This indicates that capital outflows from Ethereum-focused investment products are slowing down.
The decline in ETF outflows could be driven by various factors, including: * Improving macroeconomic conditions; * Easing regulatory concerns; * Market correction after a period of intense selling
Future inflows and outflows will serve as a key indicator of market sentiment and potential price movements in BTC and ETH.
Whale activity surges in Ethereum
Large investors (whales) have notably increased ETH purchases over the past 24 hours. According to Santiment, the strongest ETH exchange outflows in the last 48 hours suggest that Ethereum may have reached a local bottom.
This trend supports the theory that institutional investors are accumulating Ethereum at lower prices, using the correction as a buying opportunity. Decreasing exchange supply of ETH, in turn, creates favorable conditions for a potential rally in the future.
Nevertheless, whale activity and ETH exchange withdrawals remain important indicators to consider when making investment decisions. Upcoming market developments will determine whether optimistic projections hold true.
Intraday cryptocurrency trading strategy
I will continue to rely on any major dips in Bitcoin and Ethereum to capitalize on the ongoing bull market in the medium-term, which remains intact. For short-term trading, my strategy and conditions are detailed below.
Trading plan for Bitcoin
Buy scenarios
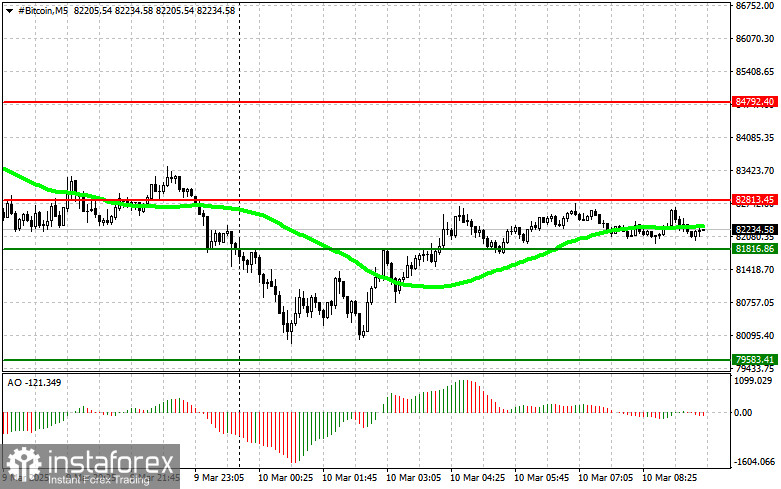
Scenario #1: Buy Bitcoin at $82,800, targeting a rise to $84,800. Exit at $84,800 and sell immediately on a pullback. Before a breakout buy, confirm that the 50-day moving average is below the current price. The Awesome Oscillator is in positive territory.
Scenario #2: We can also go long on Bitcoin from the lower border at $81,800 if there is no reaction to its breakout, aiming for $82,800 and $84,800.
Sell scenarios
Scenario #1: Sell Bitcoin at $81,800, targeting a decline to $79,500. Exit at $79,500 and buy immediately on a rebound. Before a breakout sell, confirm that the 50-day moving average is above the current price. The Awesome Oscillator is in negative territory.
Scenario #2: Sell Bitcoin from the upper border at $82,800, if there is no reaction to its breakout, aiming for $81,800 and $79,500.
Trading plan for Ethereum

Buy scenarios
Scenario #1: Buy Ethereum at $2,084, targeting a rise to $2,150. Exit at $2,150 and sell immediately on a pullback. Before a breakout buy, check that the 50-day moving average is below the current price. The Awesome Oscillator is in positive territory.
Scenario #2: We can also buy Ethereum from the lower border at $2,048, if there is no reaction to its breakout, aiming for $2,084 and $2,150.
Sell scenarios
Scenario #1: Sell Ethereum at $2,048, targeting a decline to $1,998. Exit at $1,998 and buy immediately on a rebound. Before a breakout sell, check that the 50-day moving average is above the current price. The Awesome Oscillator is in negative territory.
Scenario #2: Sell Ethereum from the upper border at $2,084, if there is no reaction to its breakout, aiming for $2,048 and $1,998.
*El análisis de mercado publicado aquí tiene la finalidad de incrementar su conocimiento, más no darle instrucciones para realizar una operación.
¡Los informes analíticos de InstaSpot lo mantendrá bien informado de las tendencias del mercado! Al ser un cliente de InstaSpot, se le proporciona una gran cantidad de servicios gratuitos para una operación eficiente.


