


¡La leyenda en el equipo de InstaSpot!
¡Leyenda! ¿Cree que es una retórica grandilocuente? Pero, ¿cómo deberíamos llamar a un hombre, que se convirtió en el primer asiático en ganar el campeonato mundial de ajedrez júnior a los 18 años y en el primer Gran Maestro indio a los 19 años? Ese fue el comienzo de un camino difícil hacia el título de Campeón del Mundo para Viswanathan Anand, el hombre que se convirtió en parte de la historia del ajedrez para siempre. ¡Ahora una leyenda más en el equipo de InstaSpot!


Borussia es uno de los clubes de fútbol con más títulos en Alemania, que ha demostrado repetidamente a los fanáticos: el espíritu de competencia y liderazgo que ciertamente conducirán al éxito. Opere de la misma manera que los profesionales del deporte: con confianza y de forma activa. ¡Mantenga un "pase" del Borussia FC y lidere con InstaSpot!
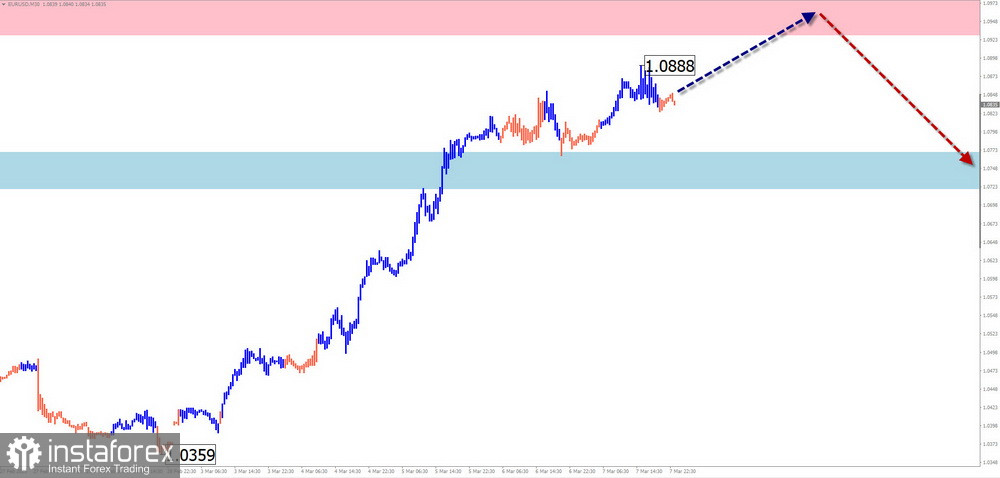
Analysis:Since early February, the euro has been forming an upward zigzag wave, marking the beginning of a new bullish trend. The pair has reached a significant potential reversal zone on the weekly timeframe, and the current wave structure appears complete.
Forecast:A moderate upward movement is expected in the first half of the upcoming week, with the euro rising toward the lower boundary of resistance. After that, a reversal is likely, leading to a price decline toward the support zone.
Potential Reversal Zones:
Trading Recommendations:
USD/JPY
Analysis:A downward wave has been forming in USD/JPY since December. The price has now reached the lower boundary of a major resistance zone on the weekly timeframe. The wave structure appears complete, and the bullish movement that started on March 6th shows potential for further upward correction.
Forecast:A sideways movement is expected throughout the week, with price action fluctuating near the lower boundary of the reversal zone. Toward the end of the week, the probability of a bullish reversal increases. A brief break below support is possible before the reversal occurs.

Potential Reversal Zones:
Trading Recommendations:
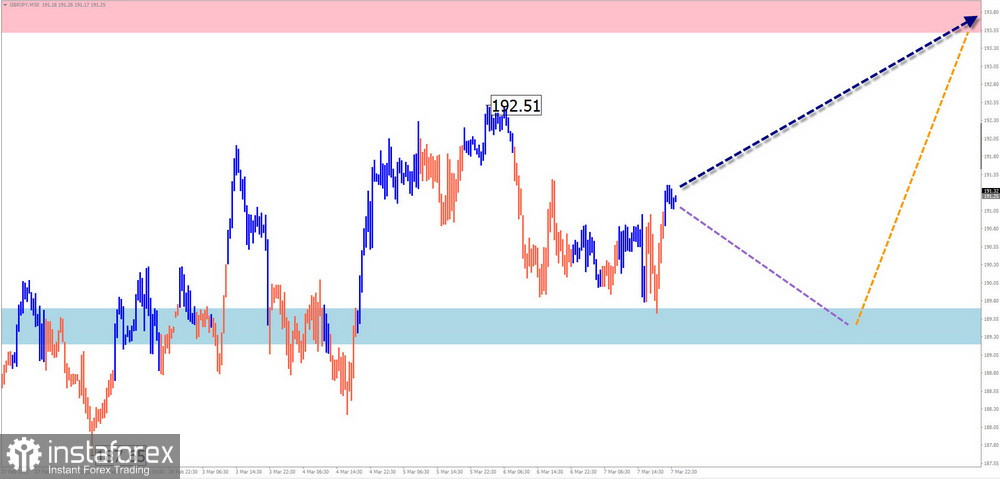
Analysis:The GBP/JPY pair has been forming a downward wave since February 13th, moving within a contracting price pattern. The pair is currently drifting along the lower boundary of a potential reversal zone on the daily timeframe.
Forecast:A sideways movement is more likely at the beginning of the week. In the support area, a reversal formation is expected, with an increased probability of price growth by the end of the week.
Potential Reversal Zones:
Trading Recommendations:
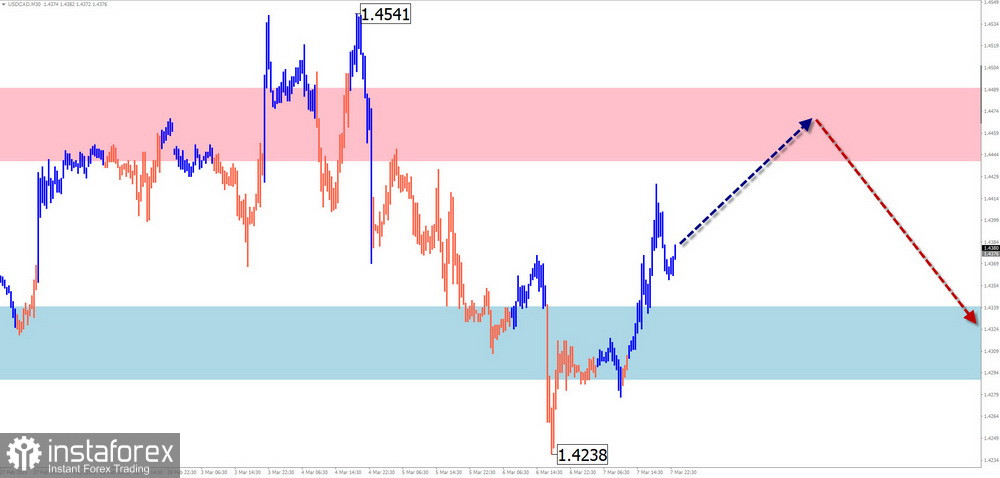
Analysis:Since February, USD/CAD has been forming a downward wave, with the ongoing correction developing as a contracting flat pattern. The pair is currently near the upper boundary of its price corridor.
Forecast:A sideways movement is expected in the coming days, followed by a bearish reversal and price decline. The downward trend may resume after the current consolidation phase ends.
Potential Reversal Zones:
Trading Recommendations:
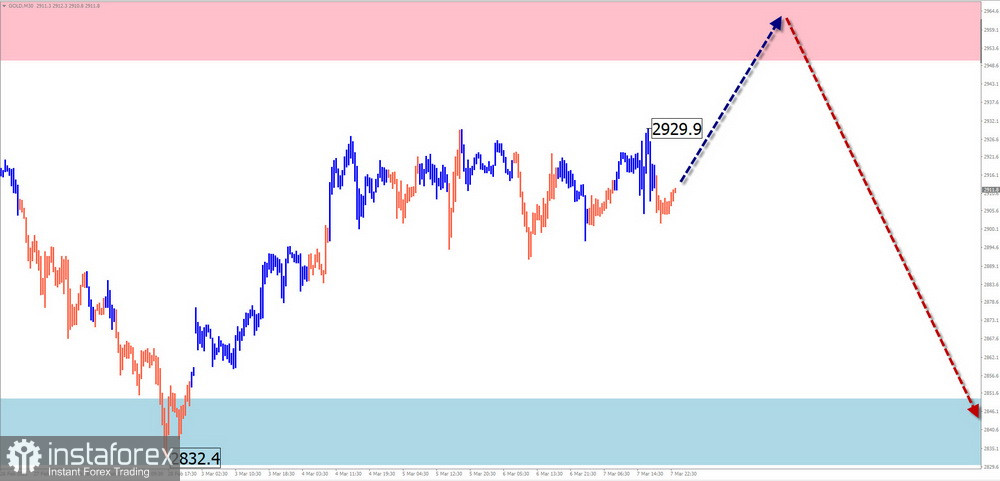
Analysis:Gold is trading near historical highs, moving within a narrow sideways range for the past month. The current wave segment is an upward correction, which appears close to completion.
Forecast:In the coming days, the price may attempt to break the upper boundary of the resistance zone. A brief breakout is possible, followed by a sharp reversal and renewed decline. The upper boundary of a major reversal zone on the weekly timeframe lies in the support area.
Potential Reversal Zones:
Trading Recommendations:
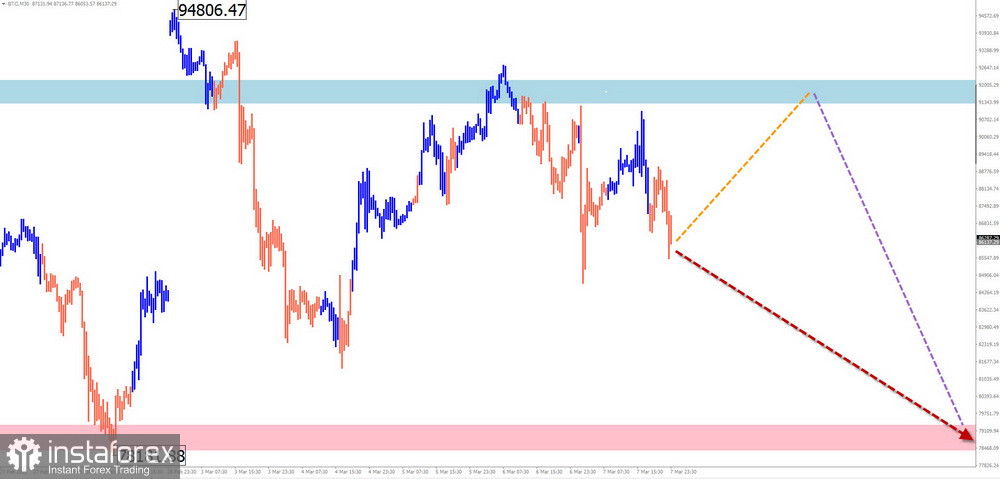
Bitcoin (BTC/USD)
Analysis: A downward wave has been forming in Bitcoin since December, with the final segment (C) developing since March 3rd. A correction is currently unfolding within this wave as a contracting flat pattern, which remains incomplete.
Forecast: A sideways trend is expected in the coming days, with a gradual rise toward the calculated resistance level. A reversal is anticipated afterward, with a possible brief break above resistance before declining. Increased volatility is expected toward the end of the week, likely aligning with the release of key economic data.
Potential Reversal Zones:
Trading Recommendations:
Explanations of the Simplified Wave Analysis (SWA):
In SWA, all waves consist of three segments (A-B-C). The analysis focuses on the last incomplete wave on each timeframe. The dotted lines indicate expected movements.
Important Notice:The wave algorithm does not account for the time duration of price movements. Therefore, while directional predictions hold, the timing of price reversals may vary.
*El análisis de mercado publicado aquí tiene la finalidad de incrementar su conocimiento, más no darle instrucciones para realizar una operación.
¡Los informes analíticos de InstaSpot lo mantendrá bien informado de las tendencias del mercado! Al ser un cliente de InstaSpot, se le proporciona una gran cantidad de servicios gratuitos para una operación eficiente.


