


¡La leyenda en el equipo de InstaSpot!
¡Leyenda! ¿Cree que es una retórica grandilocuente? Pero, ¿cómo deberíamos llamar a un hombre, que se convirtió en el primer asiático en ganar el campeonato mundial de ajedrez júnior a los 18 años y en el primer Gran Maestro indio a los 19 años? Ese fue el comienzo de un camino difícil hacia el título de Campeón del Mundo para Viswanathan Anand, el hombre que se convirtió en parte de la historia del ajedrez para siempre. ¡Ahora una leyenda más en el equipo de InstaSpot!


Borussia es uno de los clubes de fútbol con más títulos en Alemania, que ha demostrado repetidamente a los fanáticos: el espíritu de competencia y liderazgo que ciertamente conducirán al éxito. Opere de la misma manera que los profesionales del deporte: con confianza y de forma activa. ¡Mantenga un "pase" del Borussia FC y lidere con InstaSpot!
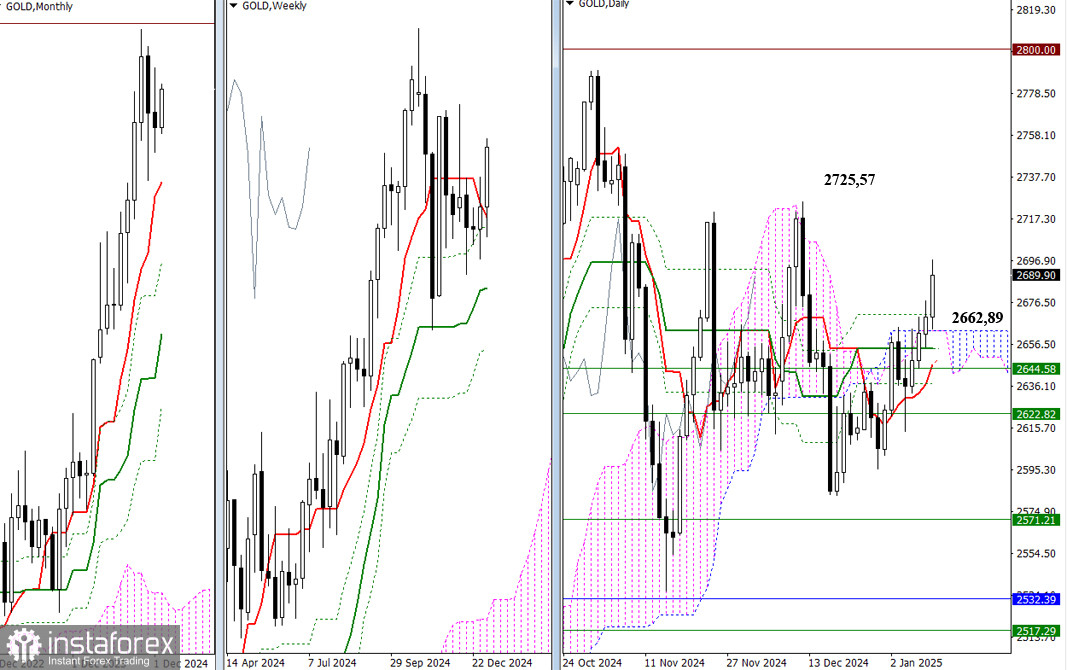
Last year produced strong results for gold, consistently recording new all-time highs. However, towards the end of the year, bearish players were able to push gold into a two-month corrective decline. The first full week of January has shown a bullish trend. Gold has reclaimed support at the weekly short-term trend of 2644.58 and has risen into the bullish zone relative to the daily cloud at 2662.95, challenging the potential elimination of the daily Ichimoku dead cross at 2671.05.
If the bulls maintain their momentum, their next targets will be the maximum highs at 2725.57 and 2789.61, followed by the psychological level of 2800.00. For the bearish players to change the current sentiment, significant effort will be required. Several key Ichimoku indicator elements are currently clustered near the price chart, including the daily cross (2671.05 – 2654.21 – 2646.51 – 2637.37), the daily cloud at 2662.89, and the weekly levels (2644.58 – 2622.82). If the bears manage to break through this support zone and consolidate below it, they could target the elimination of the weekly Ichimoku golden cross (2571.21 – 2517.29).
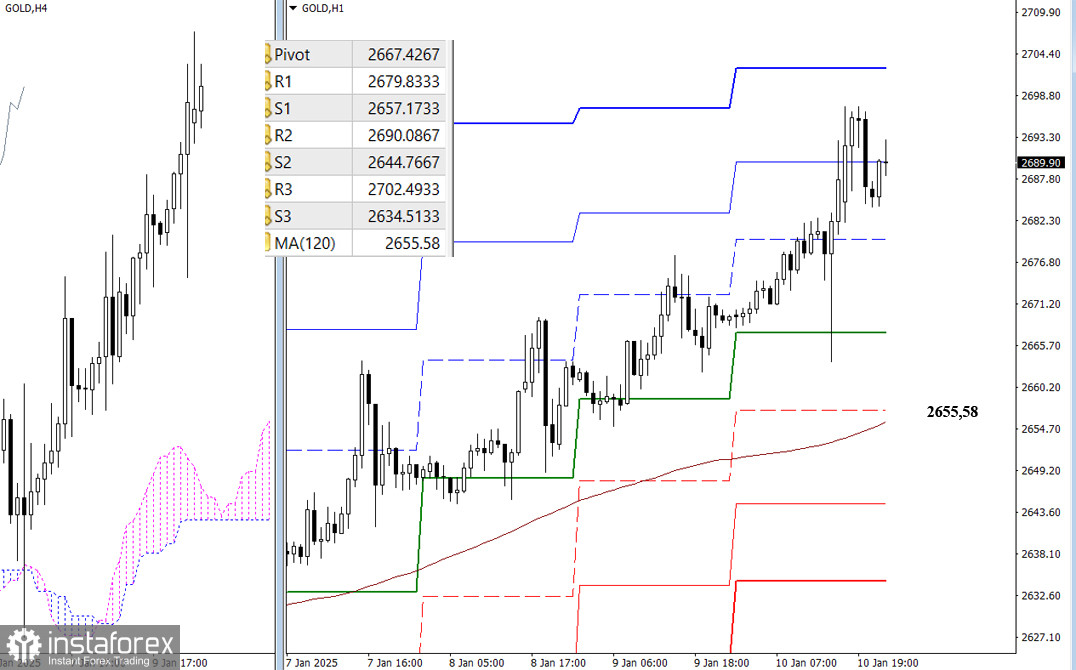
Currently, bulls hold the advantage on lower timeframes. Intraday resistance levels are determined by classic Pivot Points. If there is a corrective decline, key support levels will include the central Pivot Point for the day and the weekly long-term trend. A breakout below the long-term trend could indicate a shift in the balance of power, allowing bears to gain strength and foster further bearish sentiment. Additional support levels for a potential decline are also indicated by classic Pivot Points.
Pivot Point levels are updated daily, and the latest values for the start of the new trading week will be available upon the market's opening.
***
*El análisis de mercado publicado aquí tiene la finalidad de incrementar su conocimiento, más no darle instrucciones para realizar una operación.
¡Los informes analíticos de InstaSpot lo mantendrá bien informado de las tendencias del mercado! Al ser un cliente de InstaSpot, se le proporciona una gran cantidad de servicios gratuitos para una operación eficiente.


