


¡Nuestro equipo cuenta con más de 7,000,000 operadores!
Cada día, trabajamos juntos para mejorar las operaciones. Obtenemos grandes resultados y seguimos adelante.
El reconocimiento de millones de operadores en todo el mundo es el mejor agradecimiento a nuestro trabajo! ¡Usted hizo su elección y haremos todo lo que esté a nuestro alcance para satisfacer sus expectativas!
¡Juntos somos un gran equipo!
InstaSpot. ¡Orgulloso de trabajar para usted!


¡Actor, 6 veces ganador del torneo UFC y un verdadero héroe!
El hombre que se hizo a sí mismo. El hombre que sigue nuestro camino.
El secreto detrás del éxito de Taktarov es el constante movimiento hacia el objetivo.
¡Revele todo los lados de su talento!
Descubra, intente, fracase, ¡pero nunca se rinda!
InstaSpot. ¡Su historia de éxito comienza aquí!
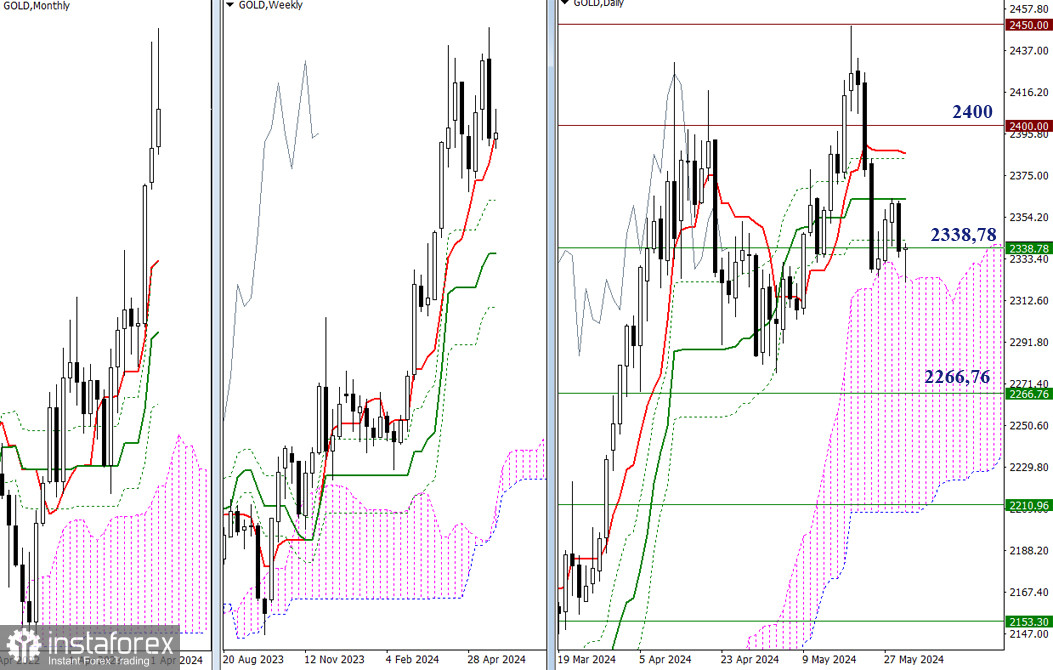
Last week, a prominent candlestick combination, an absorption pattern, was formed. However, we have not seen a confirmation or any progress on the bearish bias. This might be due to the month-end. The bears may summarize the results and return to focusing on strengthening their positions at the start of the new month. To do this, it will be crucial for them to break through the daily cloud, reinforced by weekly support levels (2266.76 – 2210.96). If the bears fail to achieve their goals, the bulls will recover their positions, reclaiming the highs to continue the upward trend. In these conditions, they will face the resistances of the daily Ichimoku cross (2363.17 – 2385.81) and the psychological levels of 2400 and 2450 that were previously tested.
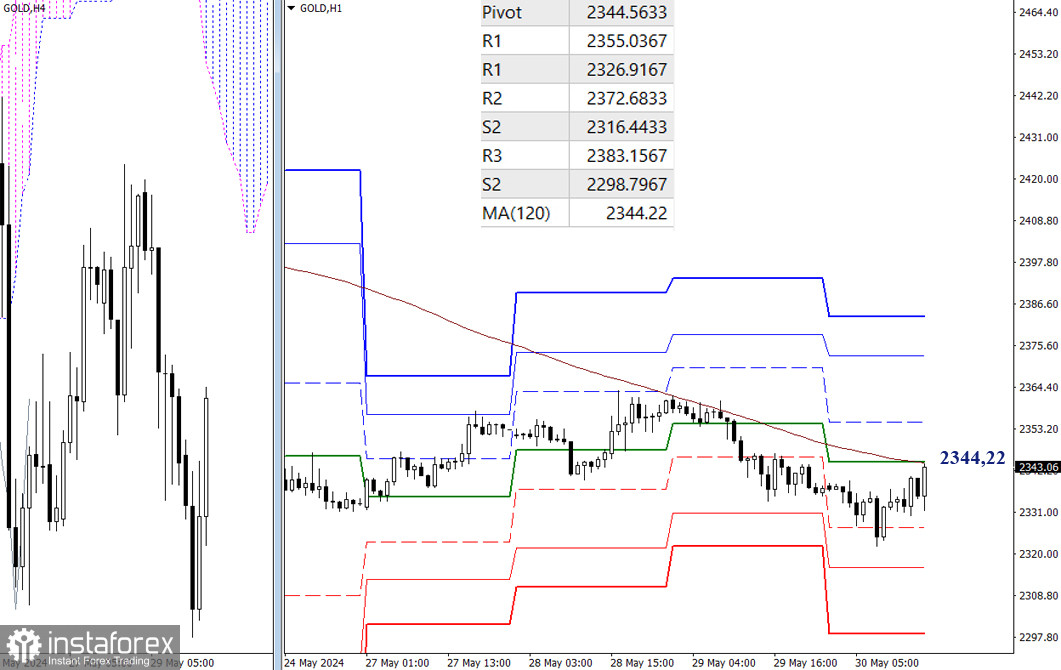
The bears have the main advantage on the lower timeframes. However, the market is closely approaching the resistance of the weekly long-term trend (2344.22). Testing, breaking through, and reversing this level could shift the balance of power in favor of the bulls. In this case, the targets for the upward movement will be the resistances of the classic Pivot levels, currently located at 2355.04, 2372.68, and 2383.16.
If the price bounces off and resumes the decline, it will initially be important to exit the correction zone (2322.06) and then proceed to test the supports of the classic Pivot levels (2316.44 – 2298.80).
***
The technical analysis of the situation uses:
Higher timeframes - Ichimoku Kinko Hyo (9.26.52) + Fibonacci Kijun levels
Lower timeframes - H1 - Pivot Points (classic) + Moving Average 120 (weekly long-term trend)
*El análisis de mercado publicado aquí tiene la finalidad de incrementar su conocimiento, más no darle instrucciones para realizar una operación.
¡Los informes analíticos de InstaSpot lo mantendrá bien informado de las tendencias del mercado! Al ser un cliente de InstaSpot, se le proporciona una gran cantidad de servicios gratuitos para una operación eficiente.


