


¡Nuestro equipo cuenta con más de 7,000,000 operadores!
Cada día, trabajamos juntos para mejorar las operaciones. Obtenemos grandes resultados y seguimos adelante.
El reconocimiento de millones de operadores en todo el mundo es el mejor agradecimiento a nuestro trabajo! ¡Usted hizo su elección y haremos todo lo que esté a nuestro alcance para satisfacer sus expectativas!
¡Juntos somos un gran equipo!
InstaSpot. ¡Orgulloso de trabajar para usted!


¡Actor, 6 veces ganador del torneo UFC y un verdadero héroe!
El hombre que se hizo a sí mismo. El hombre que sigue nuestro camino.
El secreto detrás del éxito de Taktarov es el constante movimiento hacia el objetivo.
¡Revele todo los lados de su talento!
Descubra, intente, fracase, ¡pero nunca se rinda!
InstaSpot. ¡Su historia de éxito comienza aquí!
EUR/USD
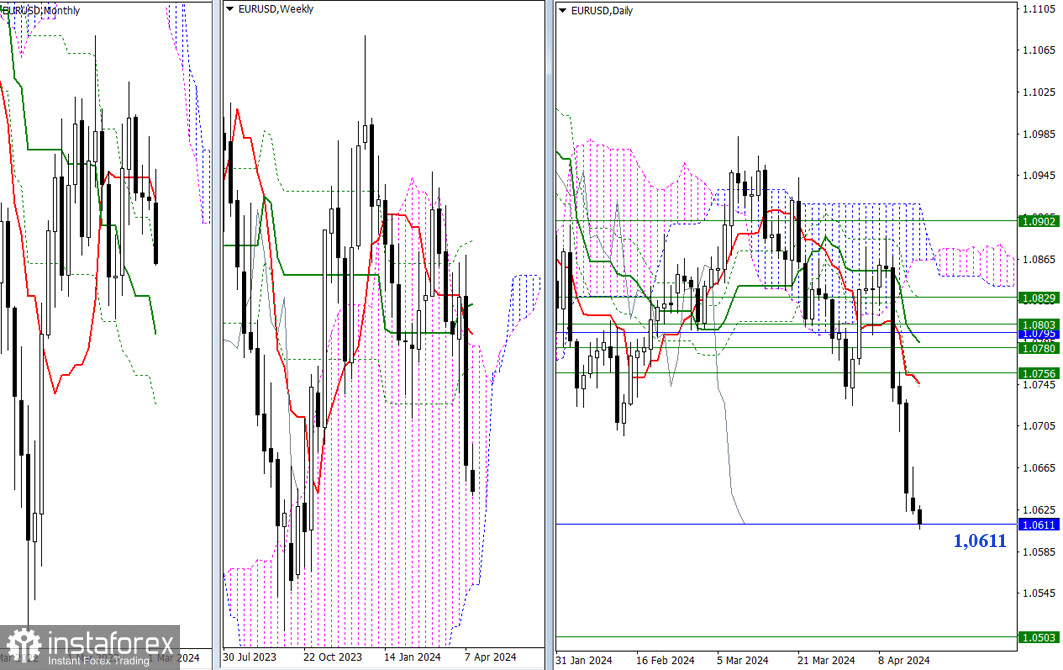
Higher Timeframes
The bears have started testing the monthly support level (1.0611). The outcome may determine the pair's possible movement. The next support level after breaking the current one (1.0611) will be the lower boundary of the weekly cloud (1.0503). In the event of a rebound, the first resistance may be provided by the daily short-term trend, which is currently at 1.0746, and with each passing day, it will move closer to the price chart.
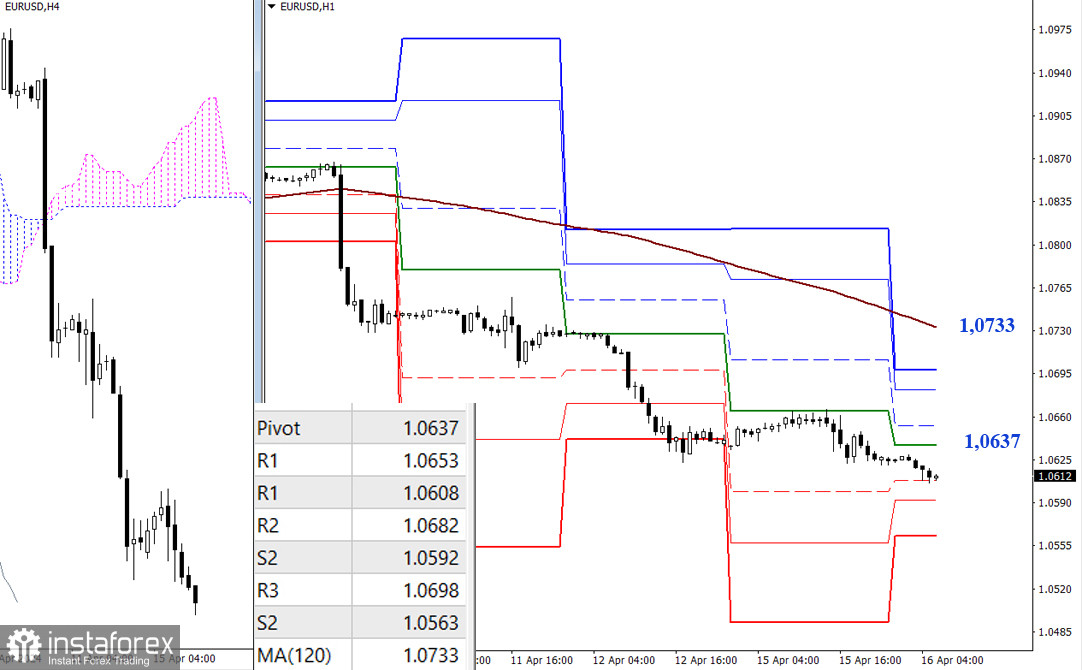
H4 – H1
On lower timeframes, the bears have left the correction zone and the pair continues to move downwards. Currently, the first support that is being tested is the classic Pivot point (1.0608). Beyond that lies S2 (1.0592) and S3 (1.0563). In case the bulls are active, the focus will be on the resistance levels, which can be found at 1.0637 – 1.0653 – 1.0682 – 1.0698 – 1.0731 (classic Pivot levels + weekly long-term trend)
***
GBP/USD
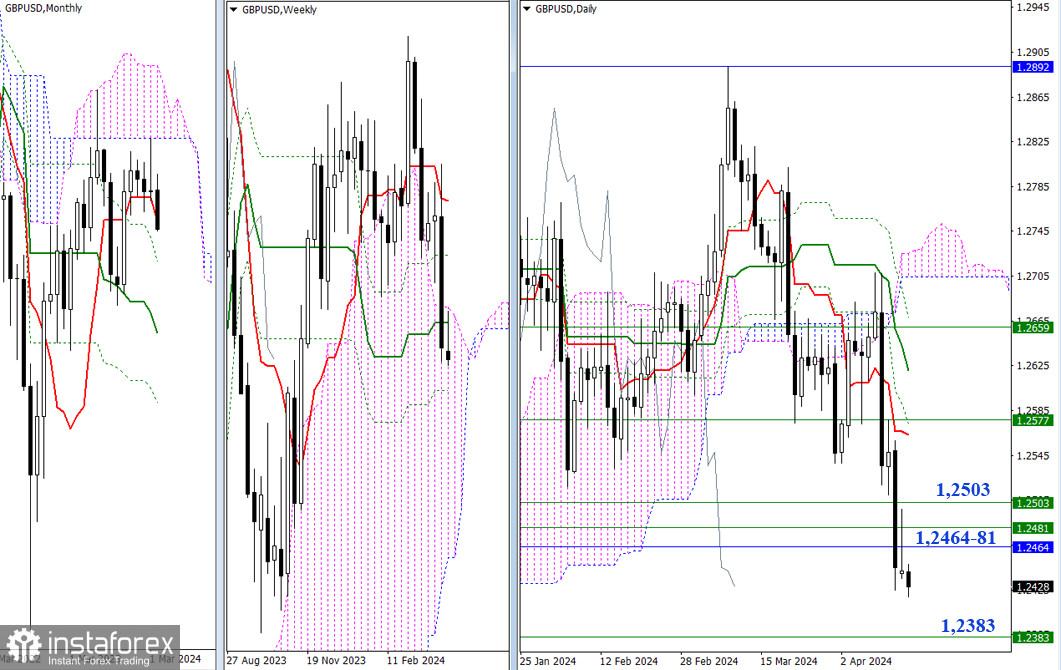
Higher Timeframes
Yesterday, the pair closed below the nearest resistance zone that has been tested (1.2464 – 1.2481 – 1.2503). The pair could rise if the price consolidates above the specified resistance levels. As for the bears, if the pair continues to fall, the next support could be found at the final level of the weekly Ichimoku Golden Cross (1.2383).
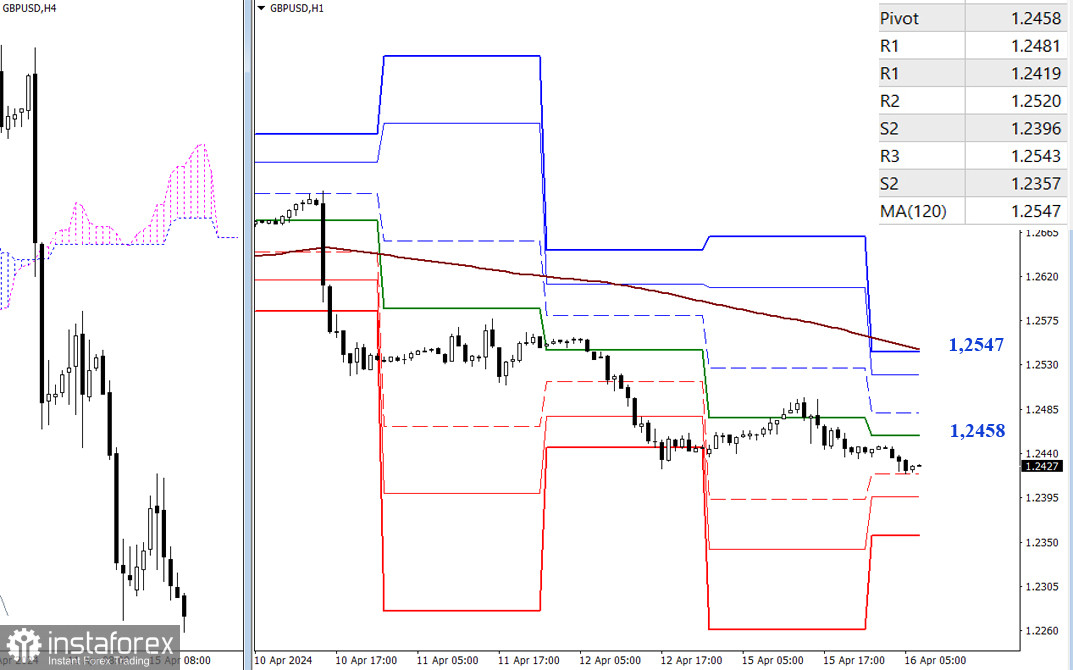
H4 – H1
The bears supported the downward movement and helped the price break out of the bullish correction, developing a downward trend. Therefore, sellers have the advantage at the moment. Currently, the first support of the classic Pivot levels (1.2419) is being tested, followed by the S2 (1.2396) and S3 (1.2357) supports. In case the pair corrects higher, the intraday bullish targets for today will be 1.2458 – 1.2481 – 1.2520 – 1.2547 (classic Pivot levels + weekly long-term trend).
***
The technical analysis of the situation uses:
Higher timeframes - Ichimoku Kinko Hyo (9.26.52) + Fibonacci Kijun levels
Lower timeframes - H1 - Pivot Points (classic) + Moving Average 120 (weekly long-term trend)
*El análisis de mercado publicado aquí tiene la finalidad de incrementar su conocimiento, más no darle instrucciones para realizar una operación.
¡Los informes analíticos de InstaSpot lo mantendrá bien informado de las tendencias del mercado! Al ser un cliente de InstaSpot, se le proporciona una gran cantidad de servicios gratuitos para una operación eficiente.


