


¡Nuestro equipo cuenta con más de 7,000,000 operadores!
Cada día, trabajamos juntos para mejorar las operaciones. Obtenemos grandes resultados y seguimos adelante.
El reconocimiento de millones de operadores en todo el mundo es el mejor agradecimiento a nuestro trabajo! ¡Usted hizo su elección y haremos todo lo que esté a nuestro alcance para satisfacer sus expectativas!
¡Juntos somos un gran equipo!
InstaSpot. ¡Orgulloso de trabajar para usted!


¡Actor, 6 veces ganador del torneo UFC y un verdadero héroe!
El hombre que se hizo a sí mismo. El hombre que sigue nuestro camino.
El secreto detrás del éxito de Taktarov es el constante movimiento hacia el objetivo.
¡Revele todo los lados de su talento!
Descubra, intente, fracase, ¡pero nunca se rinda!
InstaSpot. ¡Su historia de éxito comienza aquí!
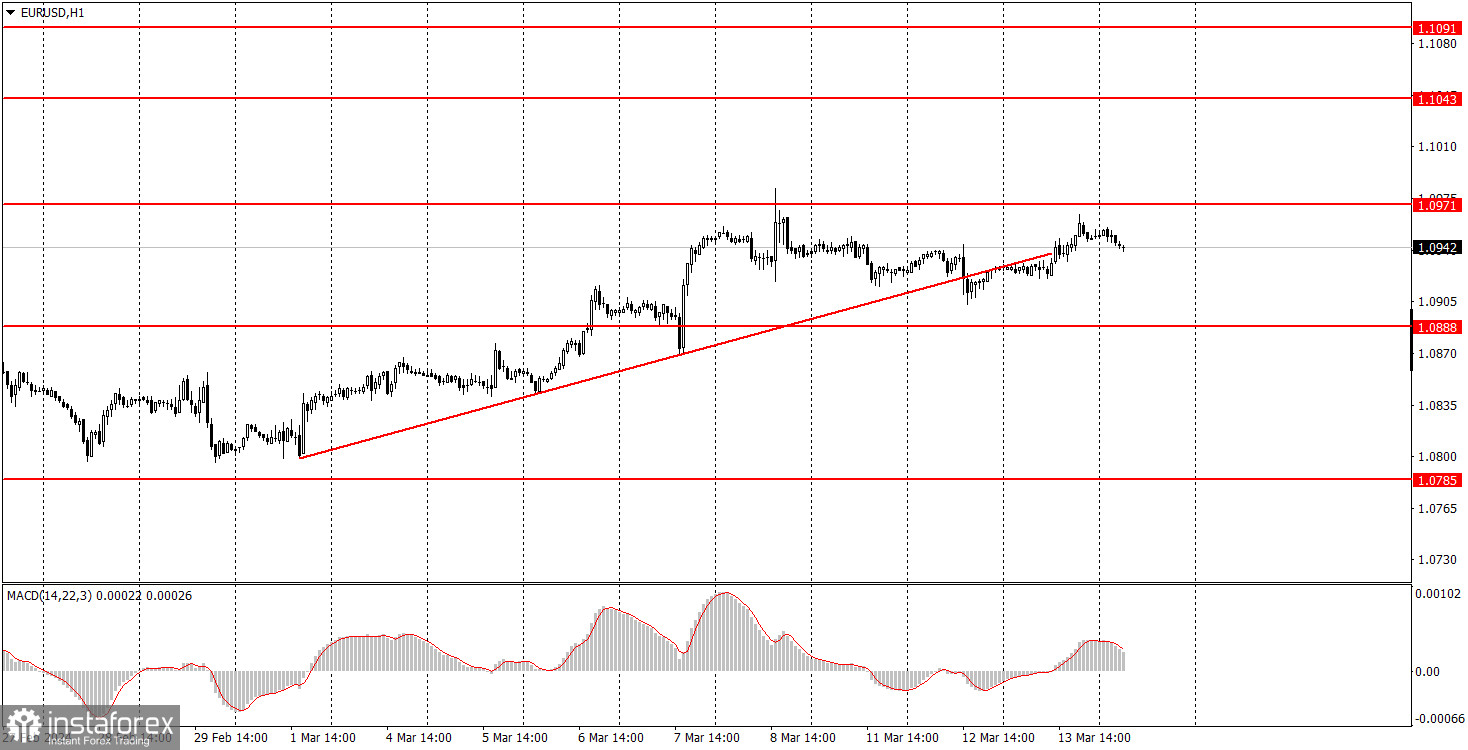
EUR/USD traded with low volatility in the absence of any trend or notable movements throughout Wednesday. If last week, the pair was gradually moving higher, now it's just moving sideways. Therefore, the situation is becoming worse day by day. Take note that the euro did manage to edge up on Wednesday. This growth, which shouldn't have happened, occurred despite the fact that the Eurozone industrial output report turned out to be a disappointment. Volumes in January decreased twice as much as forecasted. However, the market simply turned a blind eye to the report, which suggests buying the dollar.
In addition, we noticed that a couple of days ago, the price broke the trend line, and... nothing happened. After that, the market didn't even push the pair to correct lower. In general, the situation remains the same: the market continues to buy the euro regardless of the fundamental and macroeconomic background.
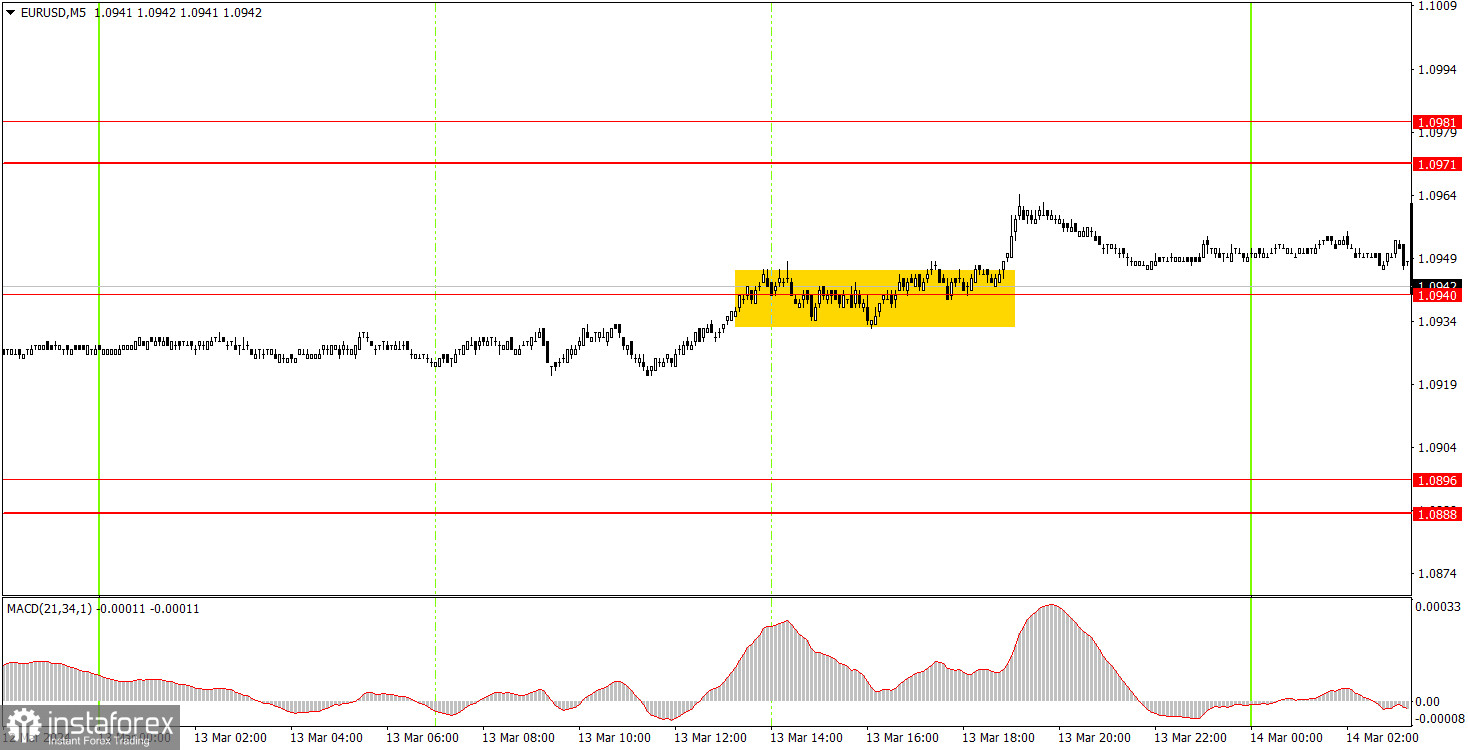
Only one signal was formed on the 5-minute timeframe. At a certain point in time, the pair encountered the level of 1.0940, and then for five hours it tried to surpass this mark. The price managed to do so closer to the evening, and within 20 minutes, the pair rose, adding about 15 pips. Obviously, it did not reach the target level, and the 15-pip increase was enough for beginners to set their Stop Loss to breakeven.
On the hourly chart, EUR/USD left the sideways channel and appears willing to resume the upward trend, although it has no fundamental reasons. We still expect the euro to resume its decline, which, in our opinion, should continue for quite some time, but the market is in no hurry to sell. Unfortunately, at the moment, we are seeing illogical movements that can be attributed to the need for an upward correction. However, even when the market has a good reason to sell, it still prefers not to do so.
The key levels on the 5M chart are 1.0568, 1.0611-1.0618, 1.0668, 1.0725, 1.0785-1.0797, 1.0855, 1.0888-1.0896, 1.0940, 1.0971-1.0981, 1.1011, 1.1043, 1.1091. On Thursday, the Eurozone event calendar is empty. The US docket will feature reports on producer prices, retail sales, and initial jobless claims. All three reports are of medium significance, and the market currently refuses to buy the dollar, even if it has a good reason to do so.
1) Signal strength is determined by the time taken for its formation (either a bounce or level breach). A shorter formation time indicates a stronger signal.
2) If two or more trades around a certain level are initiated based on false signals, subsequent signals from that level should be disregarded.
3) In a flat market, any currency pair can produce multiple false signals or none at all. In any case, the flat trend is not the best condition for trading.
4) Trading activities are confined between the onset of the European session and mid-way through the U.S. session, after which all open trades should be manually closed.
5) On the 30-minute timeframe, trades based on MACD signals are only advisable amidst substantial volatility and an established trend, confirmed either by a trendline or trend channel.
6) If two levels lie closely together (ranging from 5 to 15 pips apart), they should be considered as a support or resistance zone.
Support and Resistance price levels can serve as targets when buying or selling. You can place Take Profit levels near them.
Red lines represent channels or trend lines, depicting the current market trend and indicating the preferable trading direction.
The MACD(14,22,3) indicator, encompassing both the histogram and signal line, acts as an auxiliary tool and can also be used as a signal source.
Significant speeches and reports (always noted in the news calendar) can profoundly influence the price dynamics. Hence, trading during their release calls for heightened caution. It may be reasonable to exit the market to prevent abrupt price reversals against the prevailing trend.
Beginning traders should always remember that not every trade will yield profit. Establishing a clear strategy coupled with sound money management is the cornerstone of sustained trading success.
*El análisis de mercado publicado aquí tiene la finalidad de incrementar su conocimiento, más no darle instrucciones para realizar una operación.
¡Los informes analíticos de InstaSpot lo mantendrá bien informado de las tendencias del mercado! Al ser un cliente de InstaSpot, se le proporciona una gran cantidad de servicios gratuitos para una operación eficiente.


