


¡Nuestro equipo cuenta con más de 7,000,000 operadores!
Cada día, trabajamos juntos para mejorar las operaciones. Obtenemos grandes resultados y seguimos adelante.
El reconocimiento de millones de operadores en todo el mundo es el mejor agradecimiento a nuestro trabajo! ¡Usted hizo su elección y haremos todo lo que esté a nuestro alcance para satisfacer sus expectativas!
¡Juntos somos un gran equipo!
InstaSpot. ¡Orgulloso de trabajar para usted!


¡Actor, 6 veces ganador del torneo UFC y un verdadero héroe!
El hombre que se hizo a sí mismo. El hombre que sigue nuestro camino.
El secreto detrás del éxito de Taktarov es el constante movimiento hacia el objetivo.
¡Revele todo los lados de su talento!
Descubra, intente, fracase, ¡pero nunca se rinda!
InstaSpot. ¡Su historia de éxito comienza aquí!
Trend analysis (Fig. 1).
The EUR/USD currency pair may move downward from the level of 1.0843 (closing of yesterday's daily candle) to 1.0822, the 8-period EMA (blue thin line). In the case of testing this level, an upward movement is possible with a target of 1.0864, the 38.2% pullback level (red dotted line).
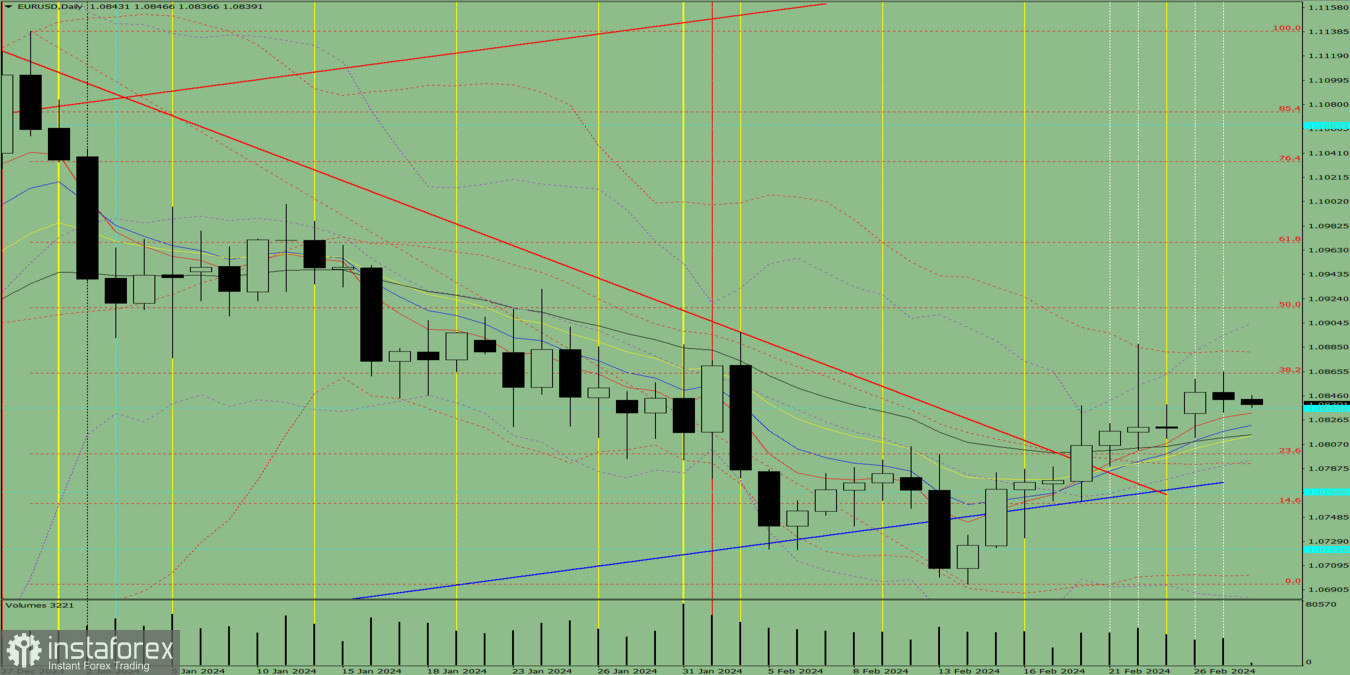
Fig. 1 (daily chart).
Comprehensive analysis:
General conclusion: Today, the price may move downward from the level of 1.0843 (closing of yesterday's daily candle) to 1.0822, the 8-period EMA (blue thin line). In the case of testing this level, an upward movement is possible with a target of 1.0864, the 38.2% pullback level (red dotted line).
Alternatively, from the level of 1.0843 (closing of yesterday's daily candle), the price may move downwards to 1.0815, the 21-period EMA (black thin line). In the case of testing this level, an upward movement is possible with a target of 1.0864, the 38.2% pullback level (red dotted line).
*El análisis de mercado publicado aquí tiene la finalidad de incrementar su conocimiento, más no darle instrucciones para realizar una operación.
¡Los informes analíticos de InstaSpot lo mantendrá bien informado de las tendencias del mercado! Al ser un cliente de InstaSpot, se le proporciona una gran cantidad de servicios gratuitos para una operación eficiente.


