


¡Nuestro equipo cuenta con más de 7,000,000 operadores!
Cada día, trabajamos juntos para mejorar las operaciones. Obtenemos grandes resultados y seguimos adelante.
El reconocimiento de millones de operadores en todo el mundo es el mejor agradecimiento a nuestro trabajo! ¡Usted hizo su elección y haremos todo lo que esté a nuestro alcance para satisfacer sus expectativas!
¡Juntos somos un gran equipo!
InstaSpot. ¡Orgulloso de trabajar para usted!


¡Actor, 6 veces ganador del torneo UFC y un verdadero héroe!
El hombre que se hizo a sí mismo. El hombre que sigue nuestro camino.
El secreto detrás del éxito de Taktarov es el constante movimiento hacia el objetivo.
¡Revele todo los lados de su talento!
Descubra, intente, fracase, ¡pero nunca se rinda!
InstaSpot. ¡Su historia de éxito comienza aquí!

EUR/USD exhibited low volatility on Wednesday, and the market showed very little interest in trading. In previous articles, we warned you that the euro is not a volatile currency, so even in the presence of a clear trend (as is the case now), we shouldn't expect the pair to fall every day. This is confirmed in practice. If on Tuesday, the market reacted with a firm bearish bias to the US inflation report, which is considered important, and its value turned out to be resonant, now there were no important reports. Therefore, we observed volatility equal to 38 pips.
The EU released reports on GDP and industrial production. We already warned you that in paper, these are considered important reports, but in practice, they are unlikely to influence market sentiment significantly. The second estimate of GDP for the fourth quarter did not differ from the previous estimate, and industrial production, although it grew in December, is still not a crucial indicator.
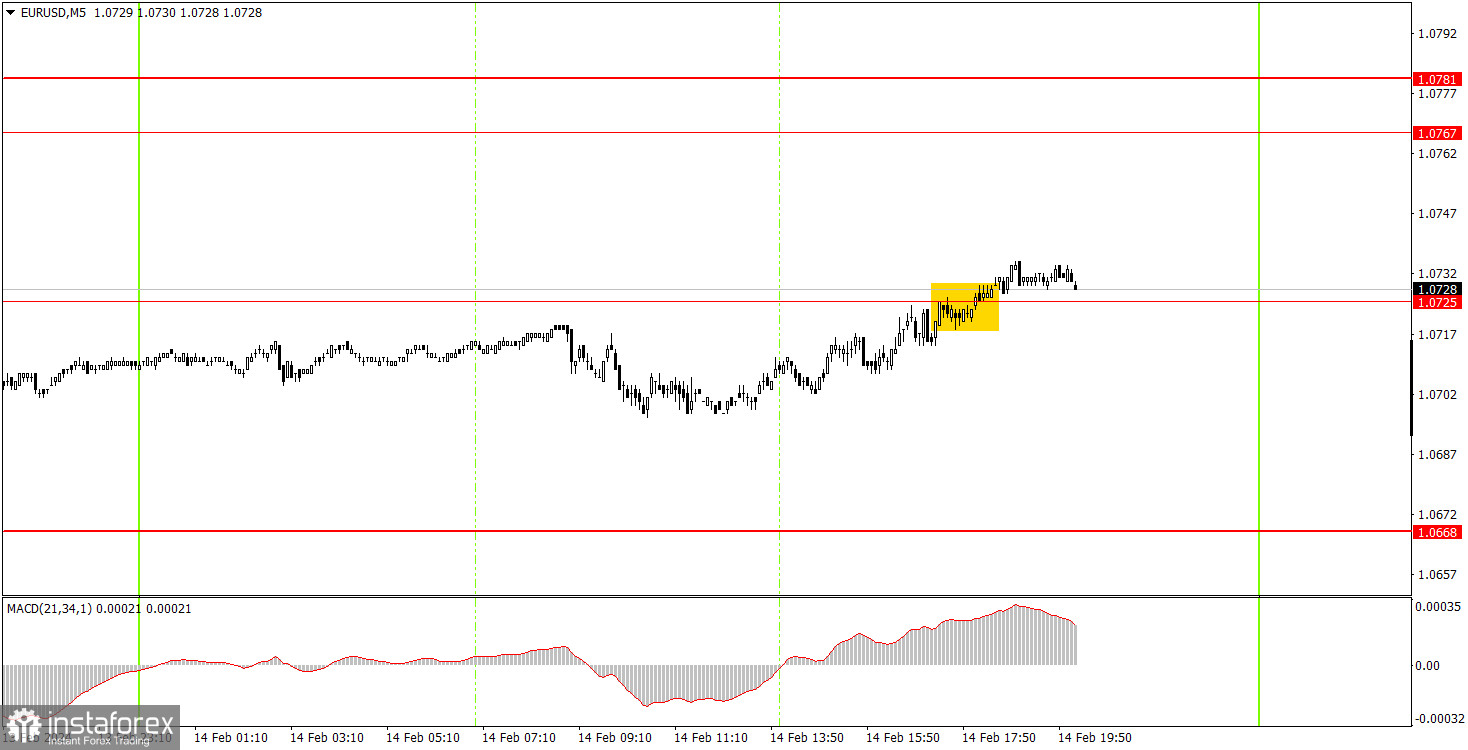
The 5-minute timeframe clearly shows that there were practically no movements on Wednesday. The first trading signal was formed in the middle of the U.S. trading session when the pair crossed the level of 1.0725. After forming a signal, the price could not even rise by 10 pips. Not because the signal was weak or inaccurate, but because volatility was low. Thus, the day ended without profit or loss.
On the hourly chart, the downtrend remains intact. We still expect the euro to show a pronounced decline, as the fundamental and macroeconomic background cannot support it at the moment. At the same time, we shouldn't expect the euro to fall everyday or exhibit strong movements. We noticed that the market is actively trading only when there are fundamental reasons for it.
The key levels on the 5M chart are 1.0568, 1.0611-1.0618, 1.0668, 1.0725, 1.0767-1.0781, 1.0835, 1.0896-1.0904, 1.0940, 1.0971-1.0981, 1.1011, 1.1043, 1.1091. European Central Bank President Christine Lagarde will speak, which could be the event that pulls down the euro. The U.S. will release secondary reports on industrial production, retail sales, and unemployment claims. They may only provoke a weak market reaction.
1) Signal strength is determined by the time taken for its formation (either a bounce or level breach). A shorter formation time indicates a stronger signal.
2) If two or more trades around a certain level are initiated based on false signals, subsequent signals from that level should be disregarded.
3) In a flat market, any currency pair can produce multiple false signals or none at all. In any case, the flat trend is not the best condition for trading.
4) Trading activities are confined between the onset of the European session and mid-way through the U.S. session, after which all open trades should be manually closed.
5) On the 30-minute timeframe, trades based on MACD signals are only advisable amidst substantial volatility and an established trend, confirmed either by a trendline or trend channel.
6) If two levels lie closely together (ranging from 5 to 15 pips apart), they should be considered as a support or resistance zone.
Support and Resistance price levels can serve as targets when buying or selling. You can place Take Profit levels near them.
Red lines represent channels or trend lines, depicting the current market trend and indicating the preferable trading direction.
The MACD(14,22,3) indicator, encompassing both the histogram and signal line, acts as an auxiliary tool and can also be used as a signal source.
Significant speeches and reports (always noted in the news calendar) can profoundly influence the price dynamics. Hence, trading during their release calls for heightened caution. It may be reasonable to exit the market to prevent abrupt price reversals against the prevailing trend.
Beginning traders should always remember that not every trade will yield profit. Establishing a clear strategy coupled with sound money management is the cornerstone of sustained trading success.
*El análisis de mercado publicado aquí tiene la finalidad de incrementar su conocimiento, más no darle instrucciones para realizar una operación.
¡Los informes analíticos de InstaSpot lo mantendrá bien informado de las tendencias del mercado! Al ser un cliente de InstaSpot, se le proporciona una gran cantidad de servicios gratuitos para una operación eficiente.


