


¡La leyenda en el equipo de InstaSpot!
¡Leyenda! ¿Cree que es una retórica grandilocuente? Pero, ¿cómo deberíamos llamar a un hombre, que se convirtió en el primer asiático en ganar el campeonato mundial de ajedrez júnior a los 18 años y en el primer Gran Maestro indio a los 19 años? Ese fue el comienzo de un camino difícil hacia el título de Campeón del Mundo para Viswanathan Anand, el hombre que se convirtió en parte de la historia del ajedrez para siempre. ¡Ahora una leyenda más en el equipo de InstaSpot!


Borussia es uno de los clubes de fútbol con más títulos en Alemania, que ha demostrado repetidamente a los fanáticos: el espíritu de competencia y liderazgo que ciertamente conducirán al éxito. Opere de la misma manera que los profesionales del deporte: con confianza y de forma activa. ¡Mantenga un "pase" del Borussia FC y lidere con InstaSpot!
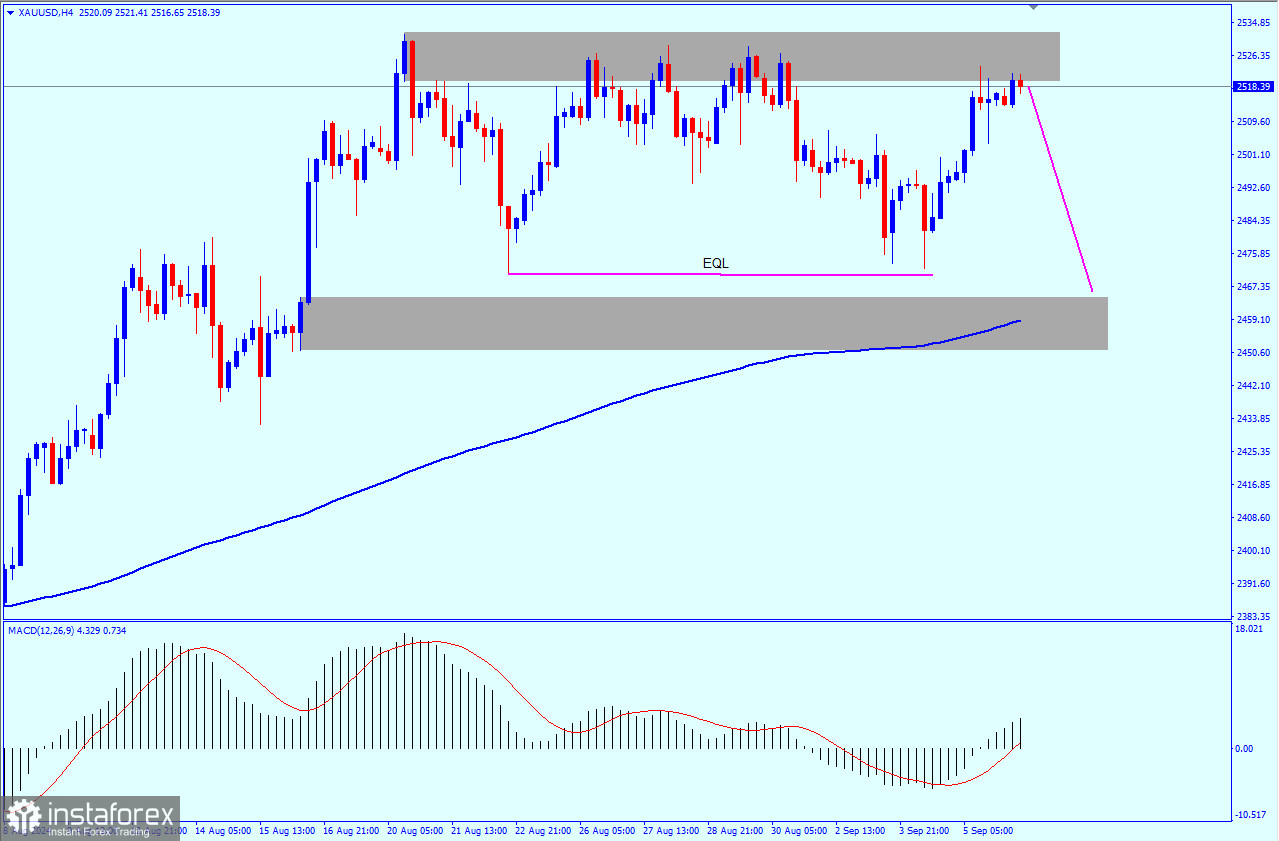
H4
In the four-hour chart, gold is in a sideways channel. This may be the stage that precedes the decline because this sideways trend occurred after a strong rise in the previous weeks. So, it may go through some corrective declines if it intends to rise again.
There is a good sign of a decline, as there is an Equal Low Level, which represents liquidity for retail traders. The price may fall to this level to make traders lose and then rebound from the order block at the level of 2,464.50.
What supports the idea of buying from this level is the EQL, as we mentioned previously, and the presence of the 200-moving average below this area, which will represent a good support area for the instrument to rebound from.
Points of interest (POI)
Buy from: 2,464.50 (it is not recommended to sell in the hope the price will fall to this level)
TP 1: 2,495 (1:2 RR)
TP 2: 2,532 (can target to break the main high)
Stop loss: 2,451 (below the OB and the MA as well)
Monthly chart
Since gold breaks every high it makes, there is no good area for gold to bounce from in the monthly time frame. The only chance to enter a trade is with the general bullish trend, but there is no chance to enter a buy trade yet either, so waiting is the best solution.
Weekly chart
In the weekly time frame, we may see some bearish movements, especially since two good signals may support the decline. There is a bullish channel that gold has formed, and a price action signal appeared at the top of this channel. The second signal is the divergence in the MACD. This is also a signal that supports the decline.
Daily chart
Almost the same thing happened in the daily time frame, but the picture became a little clearer, as the opportunity will be better in case of breaking the internal upward trend on the daily. A decline may occur after that to complete the rise if we do not see any other indication of gold weakness.
If you look at the MACD indicator, you will notice that there is a weakness in the bullish momentum. The buying activity is decreasing day after day. If gold makes lower lows, it could lose ground.
Economic news
There will be strong news in the economic calendar today: the US nonfarm payrolls. If the price does not reach the POI today even with the NFP, the POI will be valid next week
*El análisis de mercado publicado aquí tiene la finalidad de incrementar su conocimiento, más no darle instrucciones para realizar una operación.
¡Los informes analíticos de InstaSpot lo mantendrá bien informado de las tendencias del mercado! Al ser un cliente de InstaSpot, se le proporciona una gran cantidad de servicios gratuitos para una operación eficiente.


