


¡La leyenda en el equipo de InstaSpot!
¡Leyenda! ¿Cree que es una retórica grandilocuente? Pero, ¿cómo deberíamos llamar a un hombre, que se convirtió en el primer asiático en ganar el campeonato mundial de ajedrez júnior a los 18 años y en el primer Gran Maestro indio a los 19 años? Ese fue el comienzo de un camino difícil hacia el título de Campeón del Mundo para Viswanathan Anand, el hombre que se convirtió en parte de la historia del ajedrez para siempre. ¡Ahora una leyenda más en el equipo de InstaSpot!


Borussia es uno de los clubes de fútbol con más títulos en Alemania, que ha demostrado repetidamente a los fanáticos: el espíritu de competencia y liderazgo que ciertamente conducirán al éxito. Opere de la misma manera que los profesionales del deporte: con confianza y de forma activa. ¡Mantenga un "pase" del Borussia FC y lidere con InstaSpot!
The Business Activity Index in the United States services sector rose from 50.6 to 50.8, while a decline to 50.5 was expected. The manufacturing index, instead of the expected stable level of 50.0, fell to 49.4, indicating a potential slowdown in the American industry. The composite business activity index remained unchanged, although a decline from 50.7 to 50.6 was expected.
These data indicate that the economy is gradually entering a recession despite efforts to prevent it. Therefore, the Federal Reserve may begin to stimulate the economy by reducing interest rates in the face of an economic downturn.

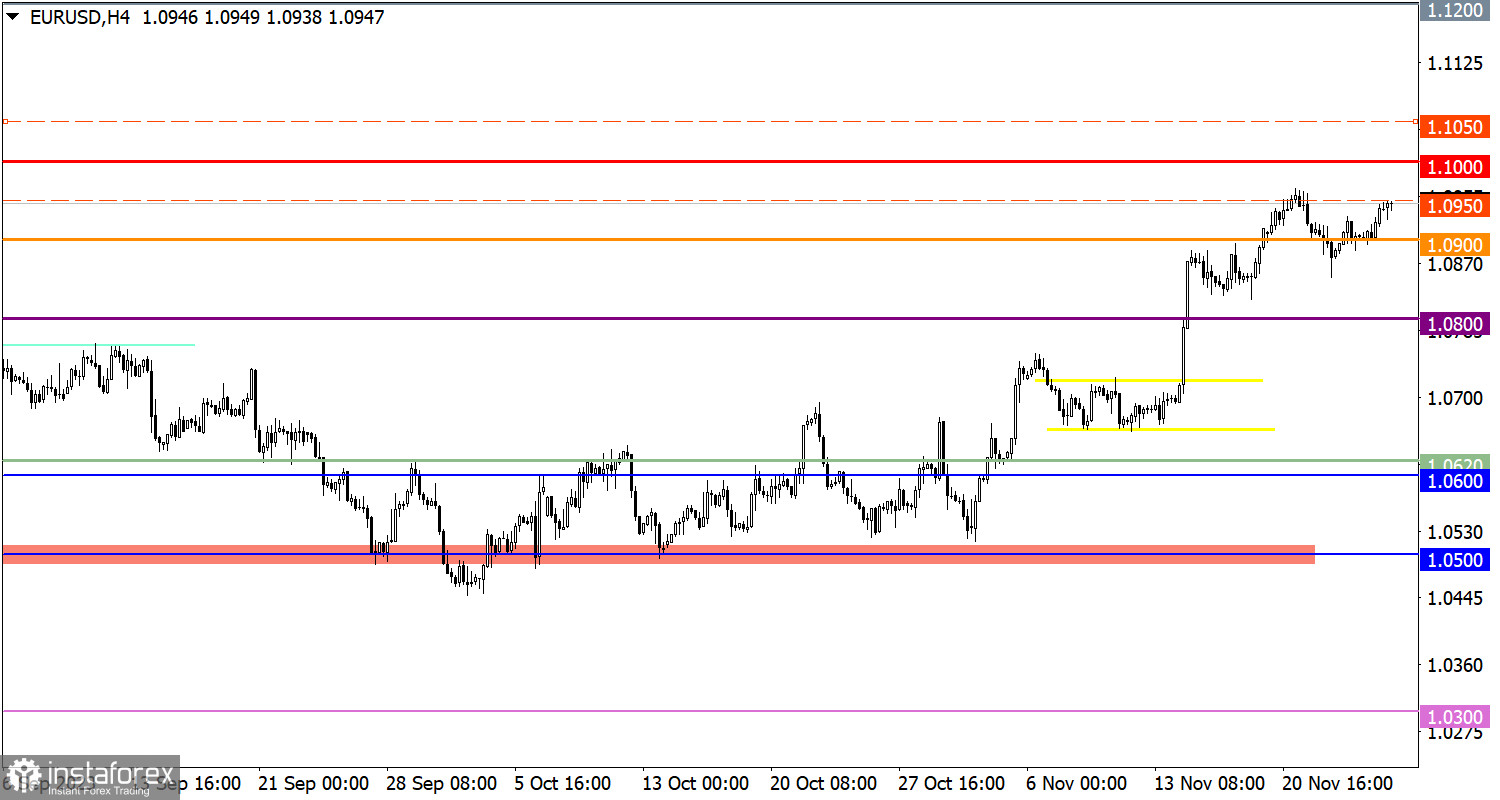
The EUR/USD currency pair increased the volume of long positions around the level of 1.0900. This led to an increase in quotes within the local high of the previous week, indicating a prevailing bullish sentiment among market participants.
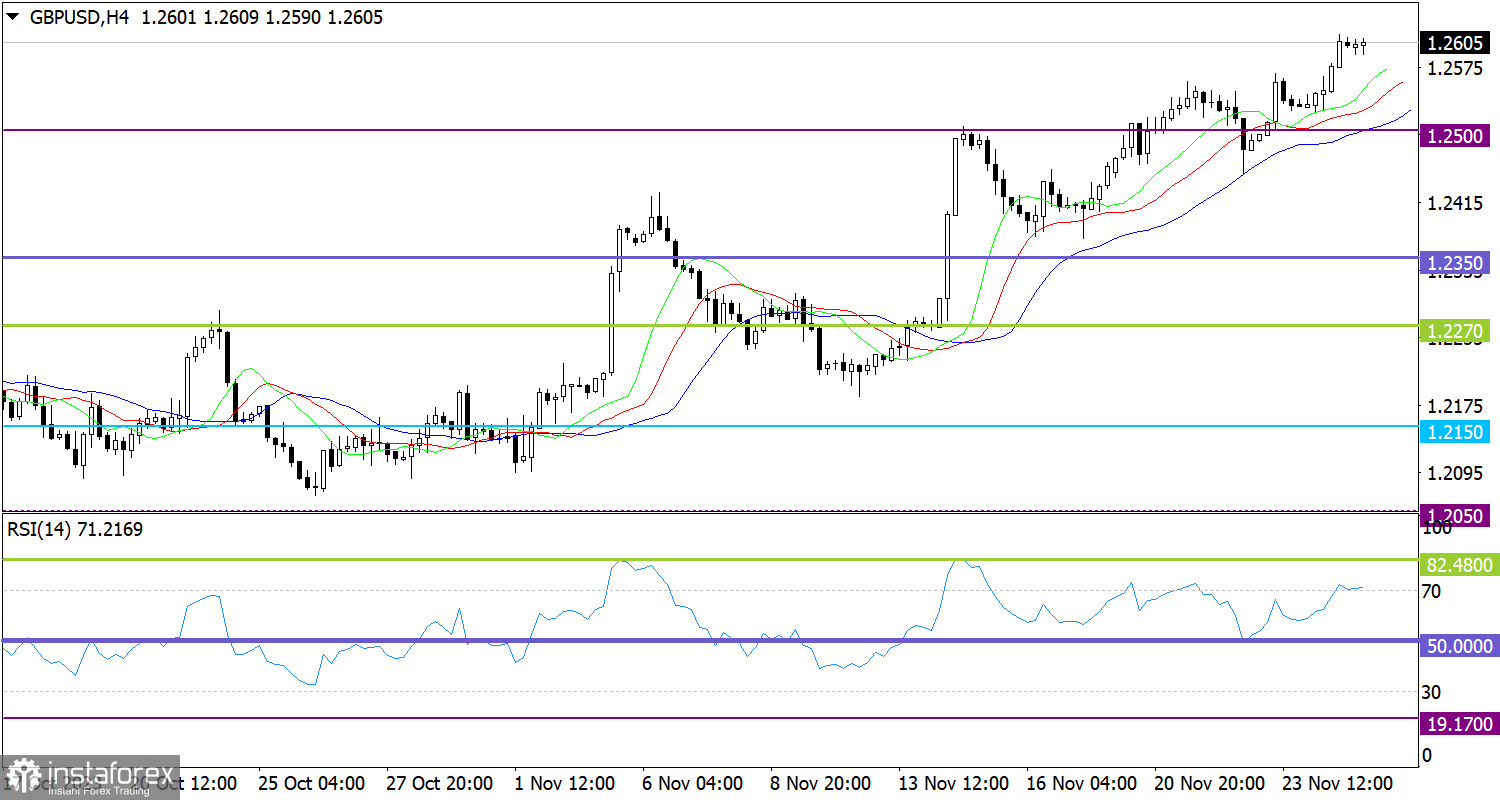
The GBP/USD pair continued its current upward cycle. Quotes rose above the level of 1.2600, indicating a step-by-step recovery of the English currency after the period from July to September, when a decline occurred.
Today, the macroeconomic calendar is practically empty, and the only thing to note is the data on new home sales in the United States, where a decrease is forecasted.
In this situation, maintaining the price above the level of 1.0950 may indicate future growth in the volume of long positions on the euro. In perspective, this movement may lead to a shift in quotes in the range of 1.1000/1.1050.
Subsequent growth could well lead to a movement in price towards the resistance level of 1.2700. This movement not only leads to an increase in the volume of long positions but also indicates the possibility of a movement towards the local high set in July.
The candlestick chart type is white and black graphic rectangles with lines above and below. With a detailed analysis of each individual candle, you can see its characteristics relative to a particular time frame: opening price, closing price, intraday high and low.
Horizontal levels are price coordinates, relative to which a price may stop or reverse its trajectory. In the market, these levels are called support and resistance.
Circles and rectangles are highlighted examples where the price reversed in history. This color highlighting indicates horizontal lines that may put pressure on the asset's price in the future.
The up/down arrows are landmarks of the possible price direction in the future.
*El análisis de mercado publicado aquí tiene la finalidad de incrementar su conocimiento, más no darle instrucciones para realizar una operación.
¡Los informes analíticos de InstaSpot lo mantendrá bien informado de las tendencias del mercado! Al ser un cliente de InstaSpot, se le proporciona una gran cantidad de servicios gratuitos para una operación eficiente.


