


¡Nuestro equipo cuenta con más de 7,000,000 operadores!
Cada día, trabajamos juntos para mejorar las operaciones. Obtenemos grandes resultados y seguimos adelante.
El reconocimiento de millones de operadores en todo el mundo es el mejor agradecimiento a nuestro trabajo! ¡Usted hizo su elección y haremos todo lo que esté a nuestro alcance para satisfacer sus expectativas!
¡Juntos somos un gran equipo!
InstaSpot. ¡Orgulloso de trabajar para usted!


¡Actor, 6 veces ganador del torneo UFC y un verdadero héroe!
El hombre que se hizo a sí mismo. El hombre que sigue nuestro camino.
El secreto detrás del éxito de Taktarov es el constante movimiento hacia el objetivo.
¡Revele todo los lados de su talento!
Descubra, intente, fracase, ¡pero nunca se rinda!
InstaSpot. ¡Su historia de éxito comienza aquí!
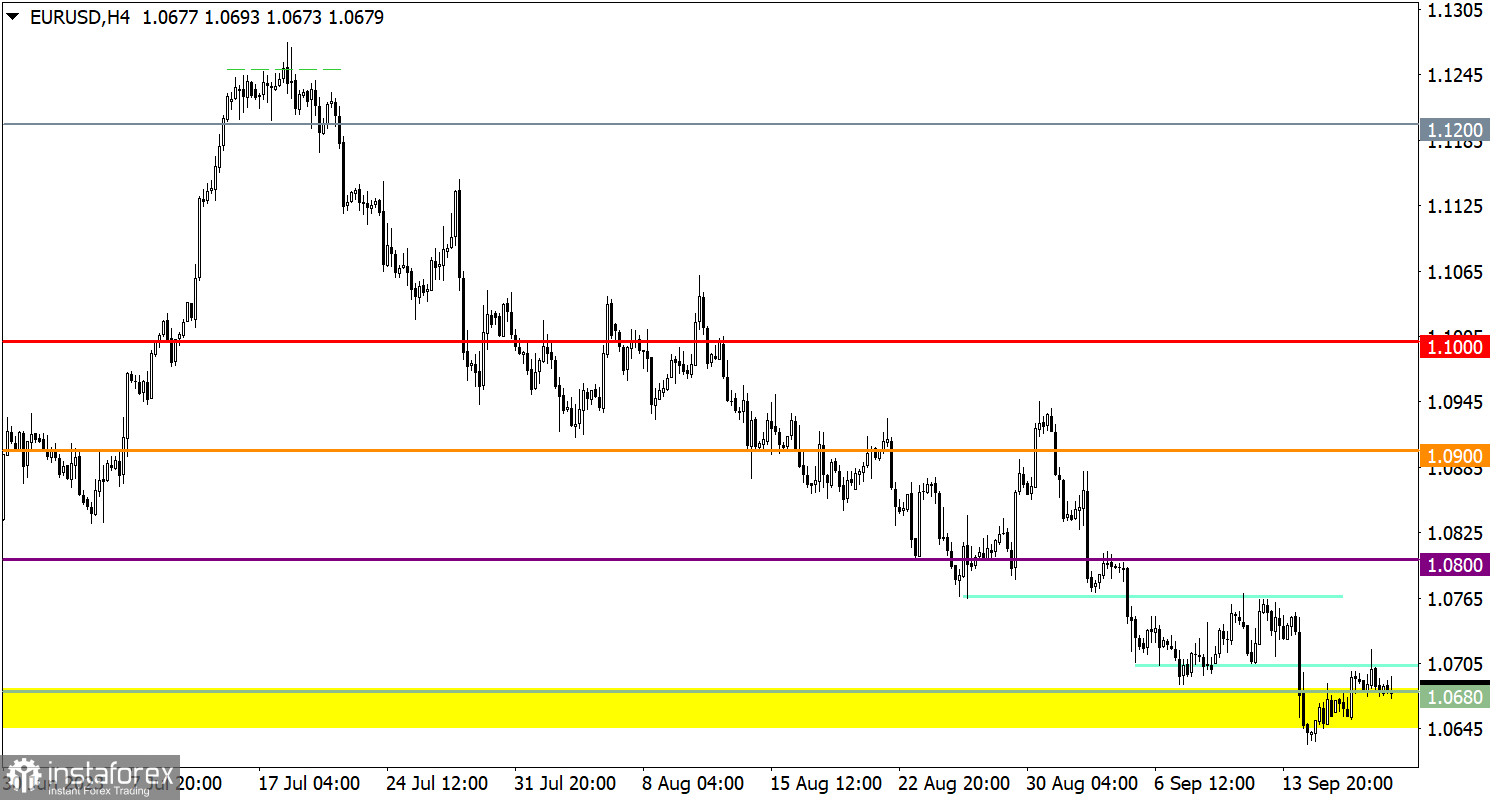
The final data on inflation in the EU surprised, showing a slowdown in the pace of consumer price growth from 5.3% to 5.2%. This is in contrast to the preliminary estimate, which indicated that it remained unchanged.
Thus, inflation in the EU is gradually decelerating, further indicating that the ECB is unlikely to raise interest rates.
The EUR/USD currency pair partially recovered its value compared to the recent decline. However, the scale of price changes is insignificant for a change in direction.
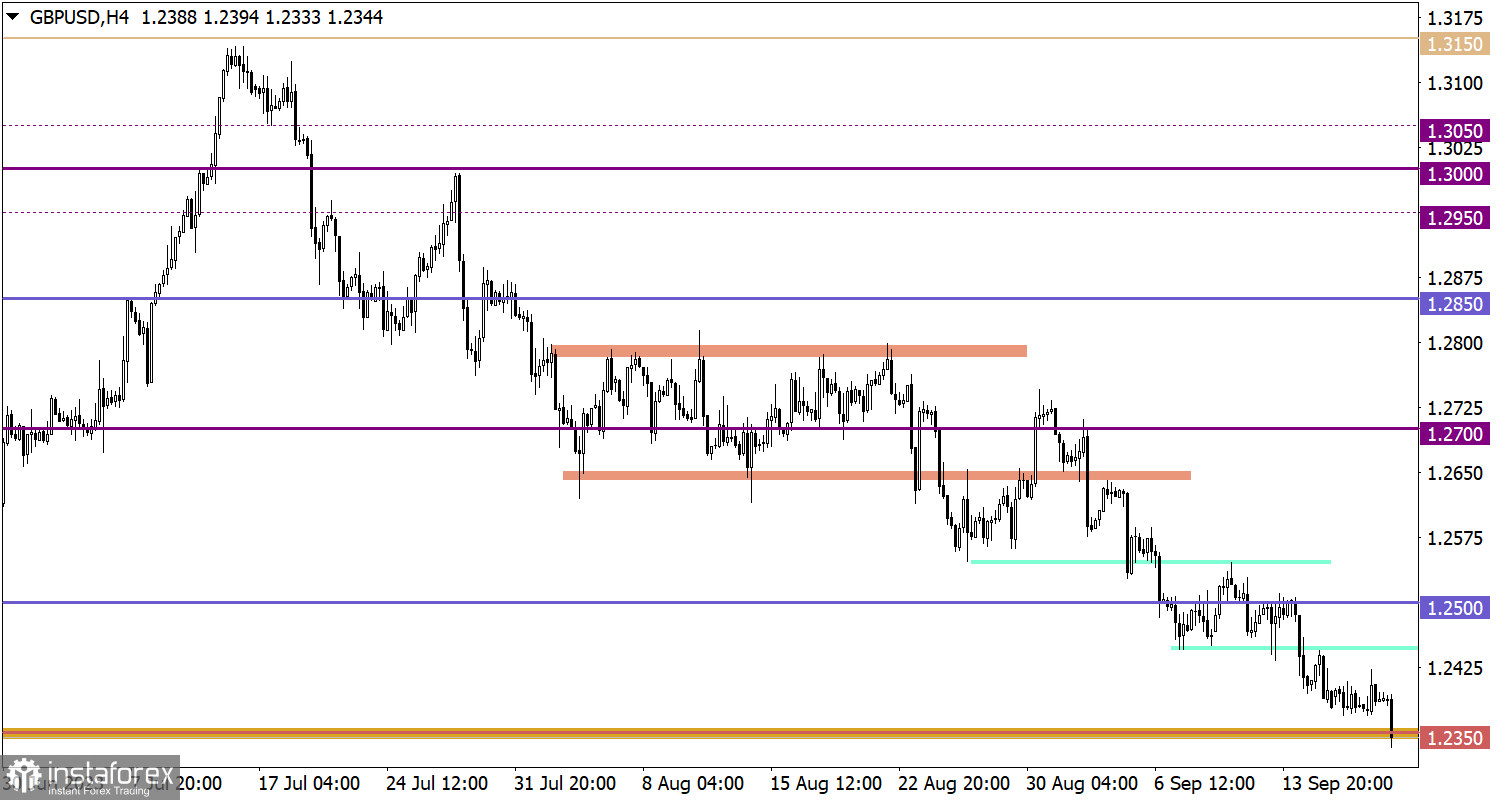
The GBP/USD pair formed a stagnation around the base of the downward trend. This movement served as a kind of accumulation of trading forces, ultimately allowing speculators to become more active.
At the opening of the European trading session, inflation data for the United Kingdom was published. Expectations were for the consumer price index to increase from 6.8% to 7.0% (YoY), but it decreased to 6.7%. In light of the new statistical data, expectations for the upcoming Bank of England meeting shifted towards a more accommodative monetary policy.
The reaction of the British pound corresponded to this, as it weakened.
The main event not only of the week but of the entire month is considered to be the first autumn meeting of the Federal Reserve System. Analysts expect that despite the rise in inflation in the United States, the regulator will decide to keep the interest rate at its current level.
The main focus will be on Fed Chairman Jerome Powell's subsequent comments. One should not expect specific details regarding monetary policy from him. Powell will likely once again mention that the decision on the refinancing rate will be based on macroeconomic dynamics and, in particular, inflation. In principle, he says this every time. However, after the ECB practically stated that it no longer plans to raise its refinancing rate, even such rhetoric from Powell will seem overly hawkish. This could also contribute to further strengthening of the dollar. However, if even indirect hints of the end of the interest rate hike cycle are voiced, it will serve as a catalyst for selling dollar positions across the market.
Speculative activity in the market will be directly related to the outcomes of the Federal Reserve meeting. Thus, the existing stagnation will be concluded today, and market volatility will follow. From a technical analysis perspective, keeping the price below the 1.0600 level would indicate a continuation of the downward cycle. Meanwhile, a price increase above 1.0750 could strengthen the euro's recovery, which would be favorable for long positions.
Volatility increased with the release of inflation data for the United Kingdom at the opening of the European session. As a result, the stagnation was concluded, and the downward cycle was extended. A stable price below the support level of 1.2300/1.2350 could favor short positions. However, it cannot be said with complete certainty that the existing support level will not exert pressure on sellers.
The candlestick chart type is white and black graphic rectangles with lines above and below. With a detailed analysis of each individual candle, you can see its characteristics relative to a particular time frame: opening price, closing price, intraday high and low.
Horizontal levels are price coordinates, relative to which a price may stop or reverse its trajectory. In the market, these levels are called support and resistance.
Circles and rectangles are highlighted examples where the price reversed in history. This color highlighting indicates horizontal lines that may put pressure on the asset's price in the future.
The up/down arrows are landmarks of the possible price direction in the future.
*El análisis de mercado publicado aquí tiene la finalidad de incrementar su conocimiento, más no darle instrucciones para realizar una operación.
¡Los informes analíticos de InstaSpot lo mantendrá bien informado de las tendencias del mercado! Al ser un cliente de InstaSpot, se le proporciona una gran cantidad de servicios gratuitos para una operación eficiente.


