


¡La leyenda en el equipo de InstaSpot!
¡Leyenda! ¿Cree que es una retórica grandilocuente? Pero, ¿cómo deberíamos llamar a un hombre, que se convirtió en el primer asiático en ganar el campeonato mundial de ajedrez júnior a los 18 años y en el primer Gran Maestro indio a los 19 años? Ese fue el comienzo de un camino difícil hacia el título de Campeón del Mundo para Viswanathan Anand, el hombre que se convirtió en parte de la historia del ajedrez para siempre. ¡Ahora una leyenda más en el equipo de InstaSpot!


Borussia es uno de los clubes de fútbol con más títulos en Alemania, que ha demostrado repetidamente a los fanáticos: el espíritu de competencia y liderazgo que ciertamente conducirán al éxito. Opere de la misma manera que los profesionales del deporte: con confianza y de forma activa. ¡Mantenga un "pase" del Borussia FC y lidere con InstaSpot!
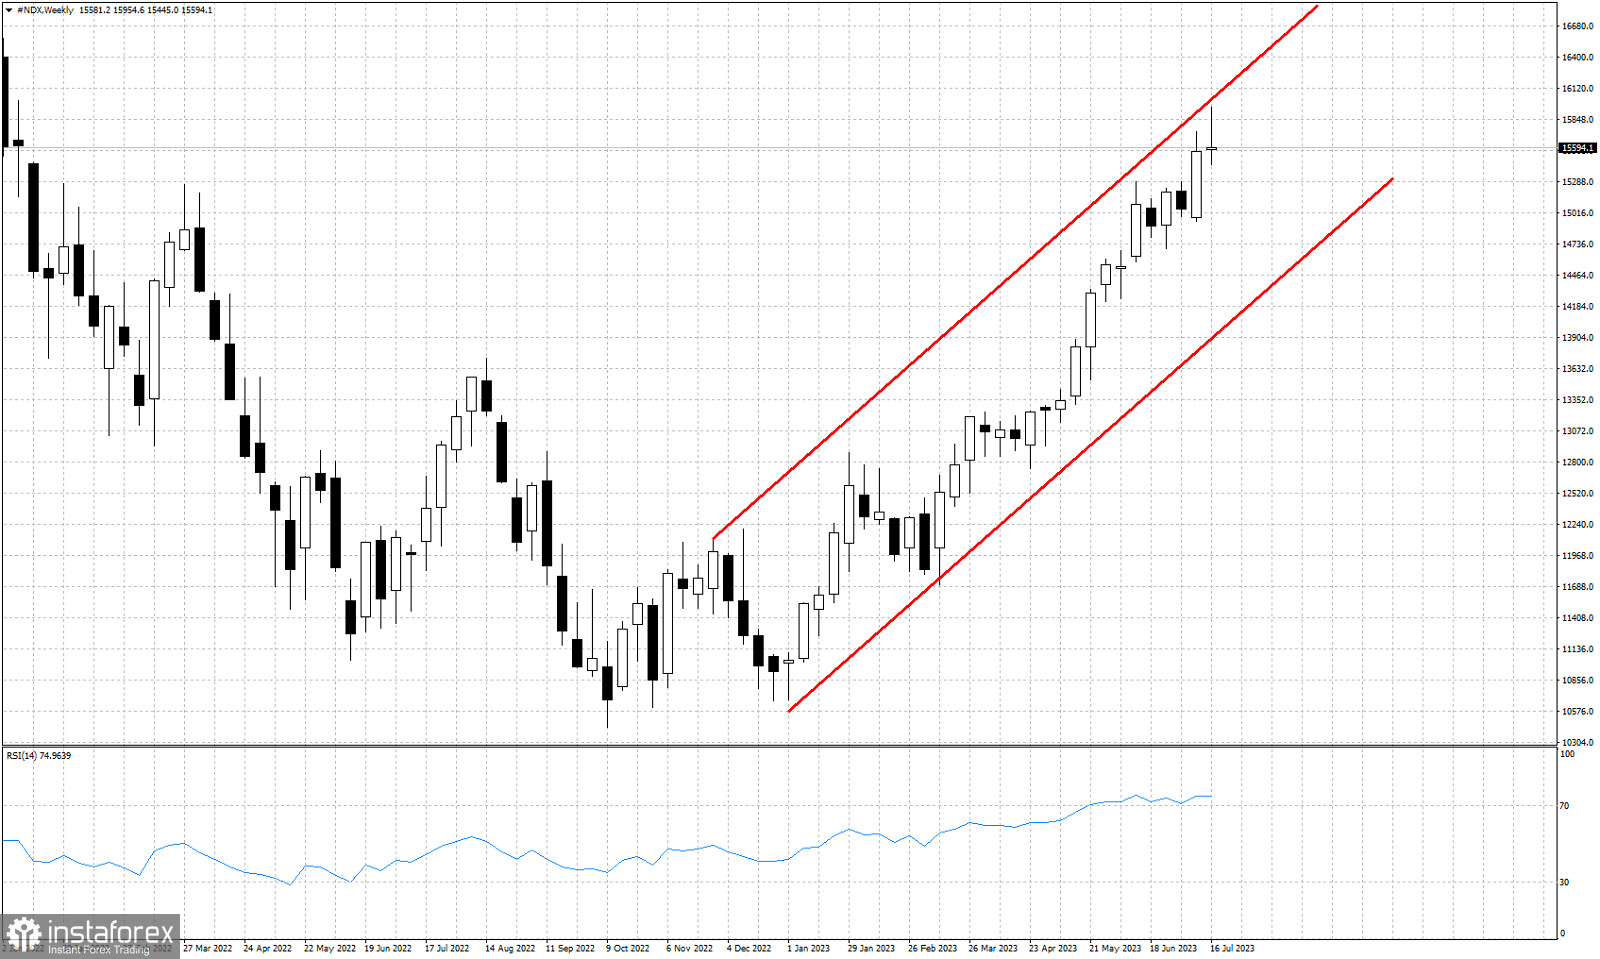
Red lines -bullish channel
NASDAQ made new higher highs this current week but is about to close near the lowest of the trading range. Price is currently around 15,600 with increased chances of a pull back. Technically trend remains bullish as price continues making higher highs and higher lows. However the weekly candle is very likely to end the week as a bearish reversal candlestick. A pull back from current levels is justified in NASDAQ. We believe the most probable scenario is for the index to pull back and approach the lower channel boundary around 14,250-14,500. The RSI is at overbought levels for several weeks. The chances of the RSI turning lower have increased. So far there is no reversal signal. If the weekly candlestick closes in negative territory and next week we see more selling pressures, then we will have a reversal signal.
*El análisis de mercado publicado aquí tiene la finalidad de incrementar su conocimiento, más no darle instrucciones para realizar una operación.
¡Los informes analíticos de InstaSpot lo mantendrá bien informado de las tendencias del mercado! Al ser un cliente de InstaSpot, se le proporciona una gran cantidad de servicios gratuitos para una operación eficiente.


