


¡La leyenda en el equipo de InstaSpot!
¡Leyenda! ¿Cree que es una retórica grandilocuente? Pero, ¿cómo deberíamos llamar a un hombre, que se convirtió en el primer asiático en ganar el campeonato mundial de ajedrez júnior a los 18 años y en el primer Gran Maestro indio a los 19 años? Ese fue el comienzo de un camino difícil hacia el título de Campeón del Mundo para Viswanathan Anand, el hombre que se convirtió en parte de la historia del ajedrez para siempre. ¡Ahora una leyenda más en el equipo de InstaSpot!


Borussia es uno de los clubes de fútbol con más títulos en Alemania, que ha demostrado repetidamente a los fanáticos: el espíritu de competencia y liderazgo que ciertamente conducirán al éxito. Opere de la misma manera que los profesionales del deporte: con confianza y de forma activa. ¡Mantenga un "pase" del Borussia FC y lidere con InstaSpot!
Yesterday the macroeconomic calendar was empty, important statistical indicators in Europe, Britain, and the United States were not published. The movement of the quotes was based on the technical picture.
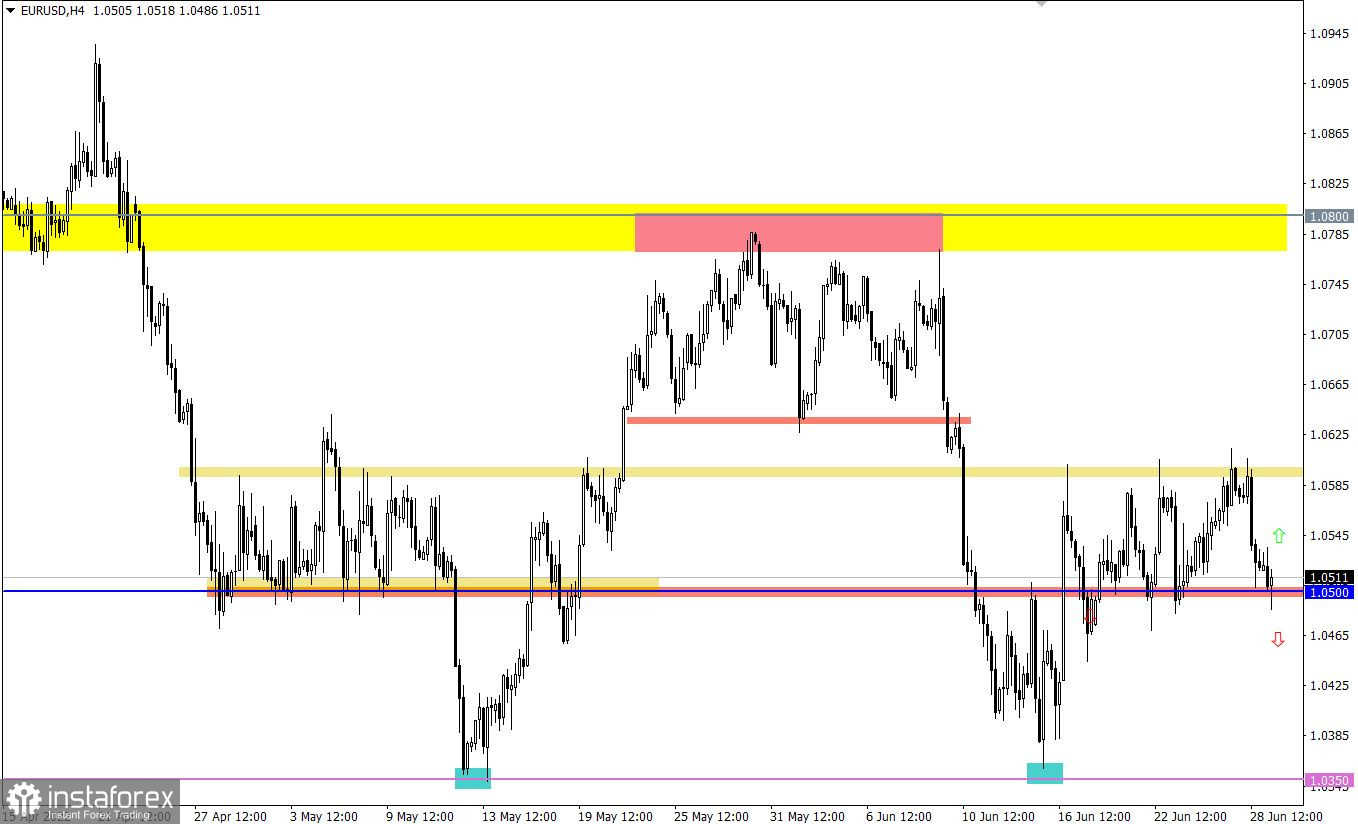
The EURUSD currency pair has been moving within the 1.0500/1.0600 side channel for the second week, where market participants managed to bounce off its upper limit during the past day. This movement led to a weakening of the euro exchange rate in the direction of the lower limit (1.0500), where due to a natural basis, there was a reduction in the volume of short positions.
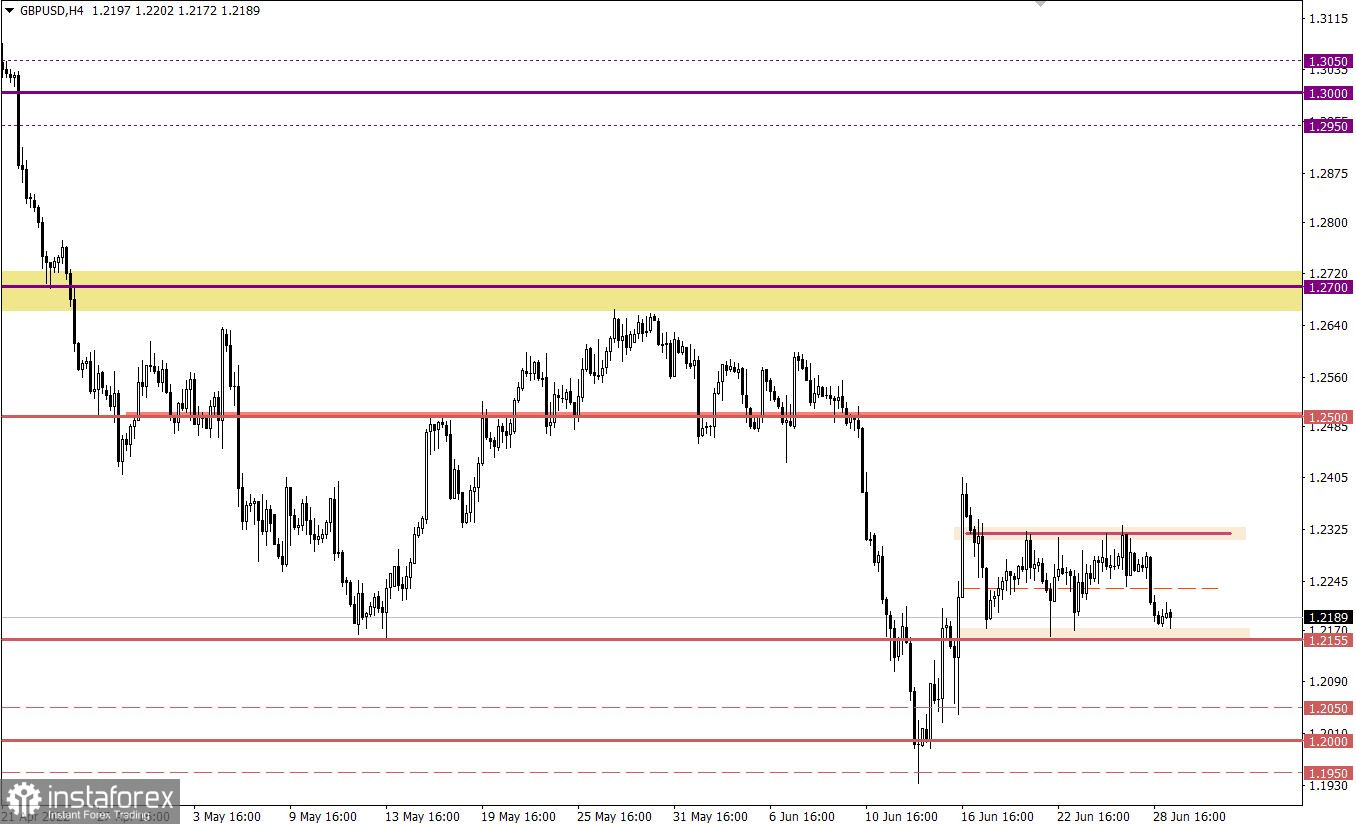
The GBPUSD currency pair, after several days of stagnation within the upper border of the flat 1.2155/1.2320, rushed down. This movement led to the subsequent formation of a lateral amplitude, where the quote reached the lower limit of the range.
Today, the third, final estimate of the GDP of the United States for the first quarter will be published. Experts believe that the assessment of economic decline in the country in January-March will be maintained at the level of 1.5%, as shown by the previous assessment. Thus, the coincidence of the data submitted with the preliminary assessment may lead to nothing, since the indicators have already been taken into account in the quotes.
The scenario of the breakdown of the lower border of the flat will be relevant only after the price keeps below the level of 1.0500 in the daily period. Until then, the risk of a price rebound towards the upper border remains.
In this situation, there is a decrease in the volume of short positions, which corresponds to a price rebound from the lower border of the flat. In case of confirmation of expectations, the quote may rush up at least to the middle line of the 1.2235 side range.
An alternative scenario will be considered by traders if the price holds below 1.2150 in a four-hour period. In this case, there will be a signal of a breakdown of the flat along a downward trajectory, which allows for a prolongation of the medium-term trend.
A candlestick chart view is graphical rectangles of white and black light, with sticks on top and bottom. When analyzing each candle in detail, you will see its characteristics of a relative period: the opening price, closing price, and maximum and minimum prices.
Horizontal levels are price coordinates, relative to which a stop or a price reversal may occur. These levels are called support and resistance in the market.
Circles and rectangles are highlighted examples where the price of the story unfolded. This color selection indicates horizontal lines that may put pressure on the quote in the future.
The up/down arrows are the reference points of the possible price direction in the future.
*El análisis de mercado publicado aquí tiene la finalidad de incrementar su conocimiento, más no darle instrucciones para realizar una operación.
¡Los informes analíticos de InstaSpot lo mantendrá bien informado de las tendencias del mercado! Al ser un cliente de InstaSpot, se le proporciona una gran cantidad de servicios gratuitos para una operación eficiente.


