


¡La leyenda en el equipo de InstaSpot!
¡Leyenda! ¿Cree que es una retórica grandilocuente? Pero, ¿cómo deberíamos llamar a un hombre, que se convirtió en el primer asiático en ganar el campeonato mundial de ajedrez júnior a los 18 años y en el primer Gran Maestro indio a los 19 años? Ese fue el comienzo de un camino difícil hacia el título de Campeón del Mundo para Viswanathan Anand, el hombre que se convirtió en parte de la historia del ajedrez para siempre. ¡Ahora una leyenda más en el equipo de InstaSpot!


Borussia es uno de los clubes de fútbol con más títulos en Alemania, que ha demostrado repetidamente a los fanáticos: el espíritu de competencia y liderazgo que ciertamente conducirán al éxito. Opere de la misma manera que los profesionales del deporte: con confianza y de forma activa. ¡Mantenga un "pase" del Borussia FC y lidere con InstaSpot!
The UK's labor market data were published yesterday, where the unemployment rate remained unchanged at 4.1%. At the same time, the number of applications for unemployment benefits in January fell by 31.9 thousand. Despite the positive data, they still coincided with market expectations, so there was no reaction.
The second estimate of Eurozone GDP for the fourth quarter reflected an acceleration in economic growth from 3.9% to 4.6%. This is a positive factor, but there was no market reaction due to the coincidence of indicators with the first estimate of GDP.
This was followed by the US producer price index data during the American trading session, the growth rate of which slowed down from 9.8% to 9.7%. It is worth considering that they predicted a slowdown in prices to 9.1%, so the current figure is not bad.
Analysis of trading charts from February 15:
The EUR/USD pair moved into a pullback stage after a sharp decline, where the level of 1.1280 serves as a variable pivot point. Based on the prices behavior in the market, there is a gradual process of restoring the downward trend relative to the recent corrective course.
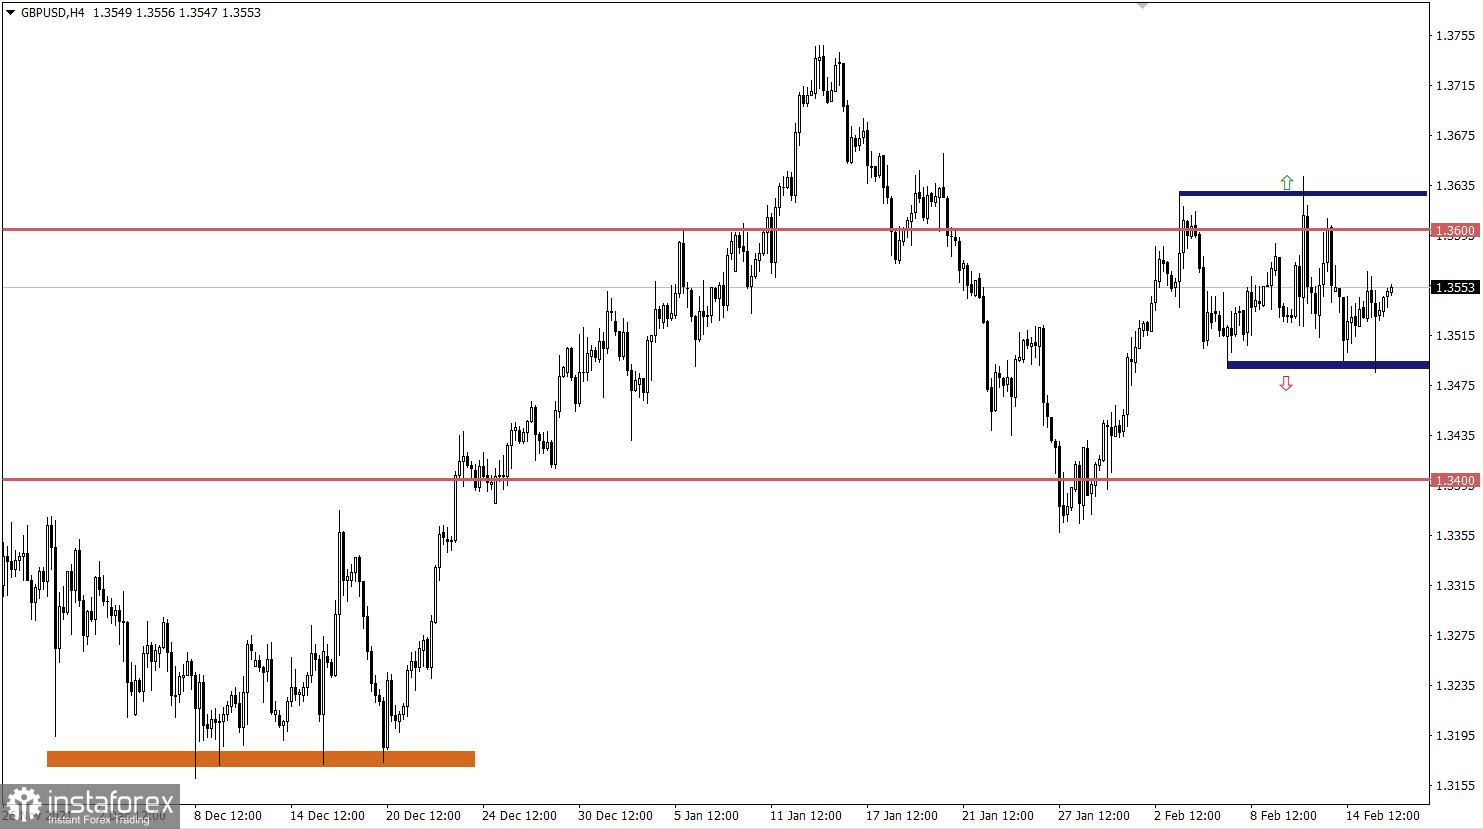
The GBP/USD currency pair remains within the limits of the side channel 1.3500/1.3600 despite a local surge in activity. A long-term movement in a closed amplitude signals the indecision of market participants to action. In turn, this can lead to a process of accumulation of trading forces, which will provoke speculators to price surges.
February 16 economic calendar:
The UK's inflation data was published today at 7:00 Universal time, where the consumer price index accelerated from 5.4% to 5.5%, which is likely to become an argument again for raising the refinancing rate by the Bank of England.
In Europe, the publication of industrial production data is expected, the rate of decline of which is likely to slow down from -1.5% to -0.5%. Therefore, we are talking about improving the situation in the EU industry.
During the US trading session, retail sales data in the United States will be published. The growth rate of which may slow down from 16.9% to 15.0%. In addition, the growth rate of industrial production is likely to slow down from 3.67% to 2.8%.
If the statistical data is confirmed, the US dollar may be under pressure.
Time targeting
EU industrial production volume - 10:00 Universal time
US retail sales volume - 13:30 Universal time
US industrial production volume - 14:15 Universal time
Trading plan for EUR/USD on Feb 16:
The technical pullback from the pivot point is still relevant in the market. In this regard, the volume of short positions fell, which led to a slowdown in restoring the downward trend. The next sell signal will appear if the price stays below the level of 1.1260 in a four-hour period.

Trading plan for GBP/USD on Feb 16:
In this situation, the trading tactics are based on the breakdown of the control values of the side channel. This strategy may indicate the subsequent path of the quote.
Let's demonstrate the above-mentioned into trading signals:
Buy positions should be considered after holding the price above the level of 1.3630 in a four-hour period.
Sell positions should be considered after holding the price below the level of 1.3480 in a four-hour period.
What is reflected in the trading charts?
A candlestick chart view is graphical rectangles of white and black light, with sticks on top and bottom. When analyzing each candle in detail, you will see its characteristics of a relative period: the opening price, closing price, and maximum and minimum prices.
Horizontal levels are price coordinates, relative to which a stop or a price reversal may occur. These levels are called support and resistance in the market.
Circles and rectangles are highlighted examples where the price of the story unfolded. This color selection indicates horizontal lines that may put pressure on the quote in the future.
The up/down arrows are the reference points of the possible price direction in the future.
*El análisis de mercado publicado aquí tiene la finalidad de incrementar su conocimiento, más no darle instrucciones para realizar una operación.
¡Los informes analíticos de InstaSpot lo mantendrá bien informado de las tendencias del mercado! Al ser un cliente de InstaSpot, se le proporciona una gran cantidad de servicios gratuitos para una operación eficiente.


