


¡La leyenda en el equipo de InstaSpot!
¡Leyenda! ¿Cree que es una retórica grandilocuente? Pero, ¿cómo deberíamos llamar a un hombre, que se convirtió en el primer asiático en ganar el campeonato mundial de ajedrez júnior a los 18 años y en el primer Gran Maestro indio a los 19 años? Ese fue el comienzo de un camino difícil hacia el título de Campeón del Mundo para Viswanathan Anand, el hombre que se convirtió en parte de la historia del ajedrez para siempre. ¡Ahora una leyenda más en el equipo de InstaSpot!


Borussia es uno de los clubes de fútbol con más títulos en Alemania, que ha demostrado repetidamente a los fanáticos: el espíritu de competencia y liderazgo que ciertamente conducirán al éxito. Opere de la misma manera que los profesionales del deporte: con confianza y de forma activa. ¡Mantenga un "pase" del Borussia FC y lidere con InstaSpot!
The UK labor market data reflected a decline in the unemployment rate from 4.3% to 4.2%, which was in line with the forecast. At the same time, employment in the country increased in October by 149 thousand against the forecast of 228 thousand. The number of applications for unemployment benefits fell in November by 49.8 thousand.
The pound sterling slowed down its upward course during the publication of statistics, but it resumed after a short stop, closing the day in the negative zone.
Europe's n industrial production data was published at 10:00 Universal time, where indicators came out slightly better than forecast. It was expected that the growth rate would slow down from 5.1% to 2.9%, but it only did to 3.3%.
Due to the divergence of expectations, the European currency slightly strengthened in value.
During the US trading session, America's producer prices were published, where their growth was recorded from 8.8% to 9.6% against the forecast of 9.2%.
The US dollar reacted positively to the statistics by strengthening.
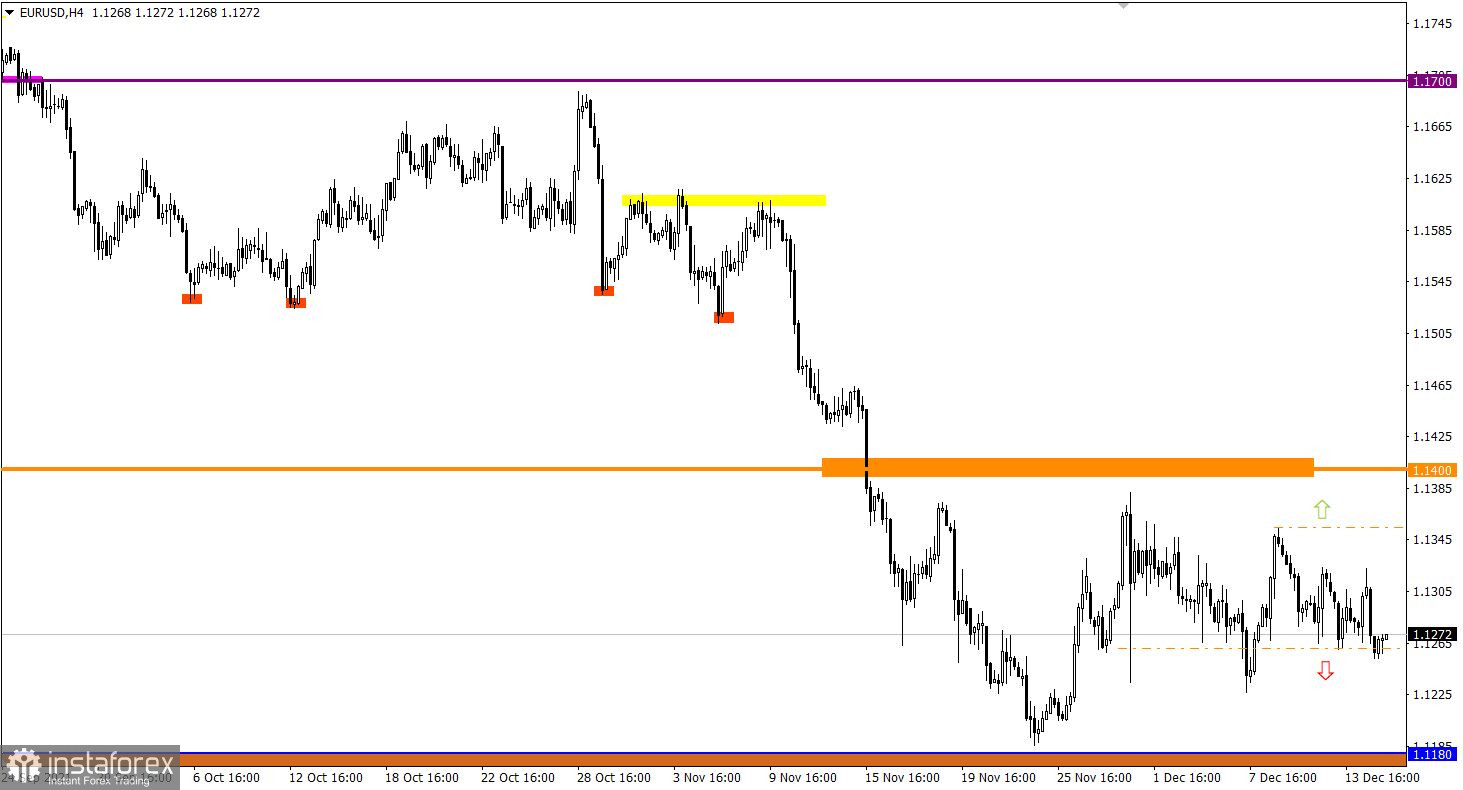
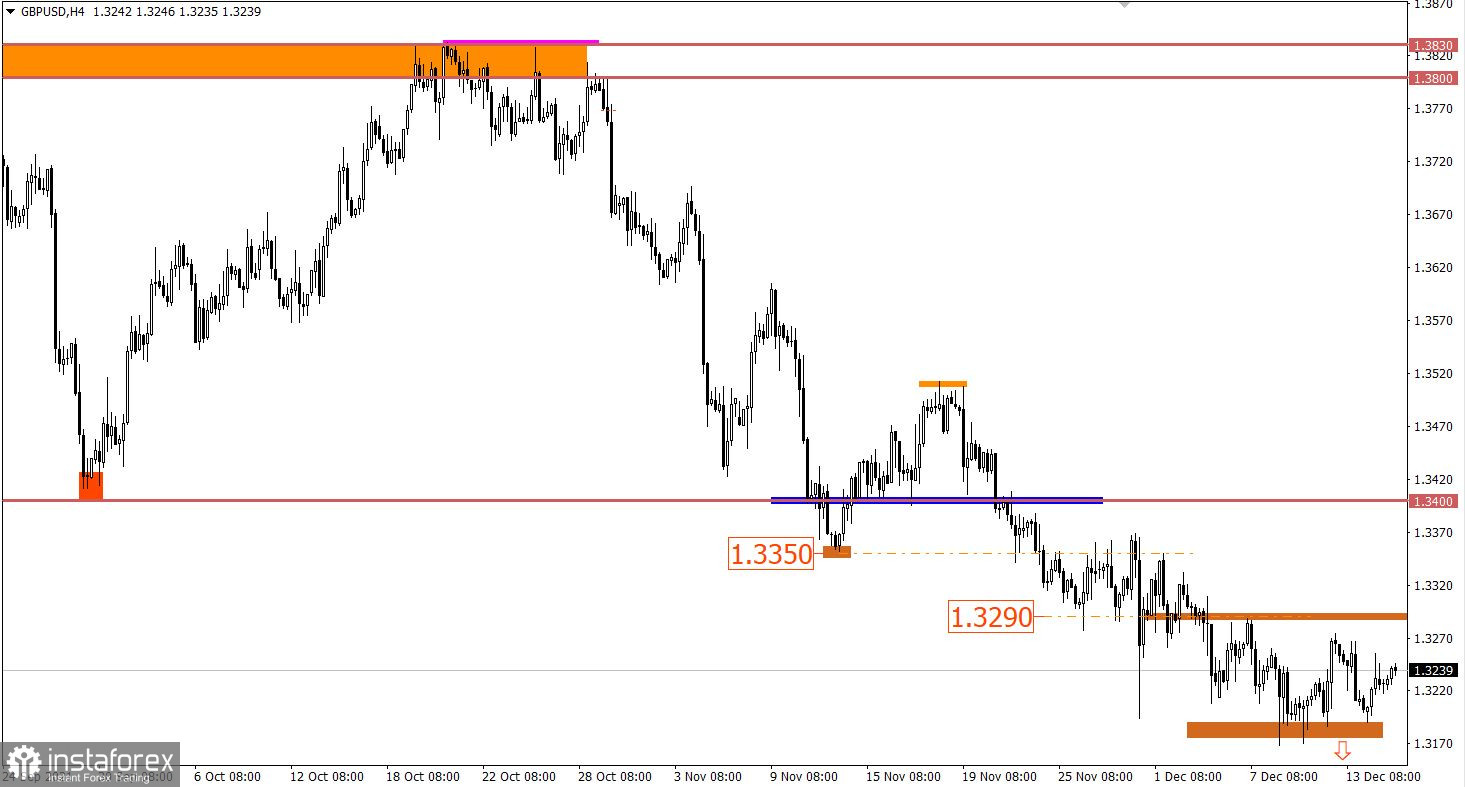
Analysis of trading charts from December 14:
The EUR/USD pair approached the lower limit of the lateral amplitude of 1.1265/1.1355, where the volume of short positions decreased on a regular basis. This led to a local slowdown of the downward cycle.
On the daily chart, there is a downward trend with a scale of 1000 points. The current correction and flat did not violate the clock component of the trend.
Following its European counterpart, the GBP/USD pair continues to move in the sideways channel 1.3200/1.3290, consistently working out the set borders. This indicates a process of accumulation of trading forces, which, as a result, will lead to a natural acceleration in the market.
Today is a very busy day in terms of the economic calendar. A lot of statistical data will be published, but the most important event of the day and month are the results of the last meeting of the Federal Reserve System (FRS) this year. The regulator is expected to provide another portion of the information on further actions. Based on the expectations of experts, the Fed may well indicate an acceleration in the pace of reducing the quantitative easing program. This will lead to multiple earlier increases in the interest rate.
It is worth carefully monitoring the comments during the press conference, as speculation on the US dollar will arise depending on Jerome Powell's speech.
Results of the meeting - 19:00 Universal time
Press conference - 19:30 Universal time
Trading plan for EUR/USD on December 15:
The sell signal will come from the market when the price is kept below the level of 1.1260 in a four-hour period. This will lead to a gradual weakening of the euro towards the support area of 1.1160/1.1180.
Until the signal is confirmed, the flat within the borders of 1.1265/1.1355 remains on the market.
The signal to sell the pound will arrive when the price is kept below the level of 1.3165 in a four-hour period. This will lead to an increase in the volume of short positions and prolongation of the downward trend. Until then, the flat in the range of 1.3200/1.3290 will remain on the market for some time.
A candlestick chart view is graphical rectangles of white and black light, with sticks on top and bottom. When analyzing each candle in detail, you will see its characteristics of a relative period: the opening price, closing price, and maximum and minimum prices.
Horizontal levels are price coordinates, relative to which a stop or a price reversal may occur. These levels are called support and resistance in the market.
Circles and rectangles are highlighted examples where the price of the story unfolded. This color selection indicates horizontal lines that may put pressure on the quote in the future.
The up/down arrows are the reference points of the possible price direction in the future.
*El análisis de mercado publicado aquí tiene la finalidad de incrementar su conocimiento, más no darle instrucciones para realizar una operación.
¡Los informes analíticos de InstaSpot lo mantendrá bien informado de las tendencias del mercado! Al ser un cliente de InstaSpot, se le proporciona una gran cantidad de servicios gratuitos para una operación eficiente.


