


¡Nuestro equipo cuenta con más de 7,000,000 operadores!
Cada día, trabajamos juntos para mejorar las operaciones. Obtenemos grandes resultados y seguimos adelante.
El reconocimiento de millones de operadores en todo el mundo es el mejor agradecimiento a nuestro trabajo! ¡Usted hizo su elección y haremos todo lo que esté a nuestro alcance para satisfacer sus expectativas!
¡Juntos somos un gran equipo!
InstaSpot. ¡Orgulloso de trabajar para usted!


¡Actor, 6 veces ganador del torneo UFC y un verdadero héroe!
El hombre que se hizo a sí mismo. El hombre que sigue nuestro camino.
El secreto detrás del éxito de Taktarov es el constante movimiento hacia el objetivo.
¡Revele todo los lados de su talento!
Descubra, intente, fracase, ¡pero nunca se rinda!
InstaSpot. ¡Su historia de éxito comienza aquí!
EUR/USD
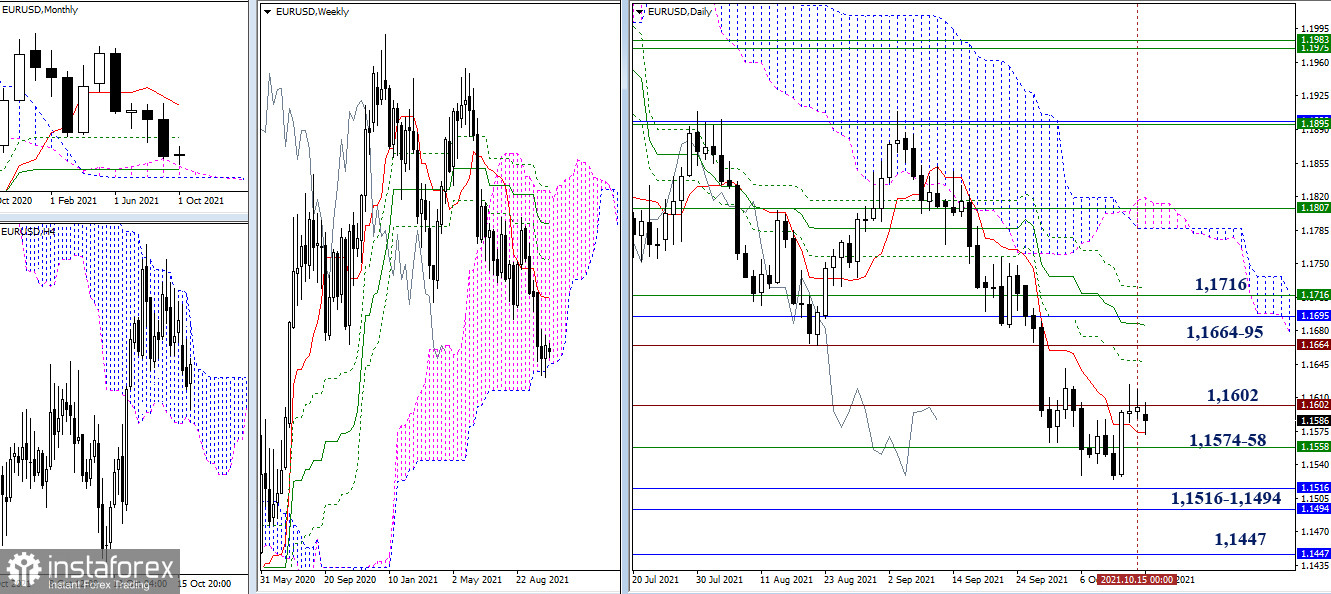
The bulls failed to secure a convincing positive result during last week's closing. The upward trend was not continued, but the deceleration below the level of 1.1602 (historical level) remained. At the same time, the strong rebound from the lower border of the weekly cloud did not work. At the moment, the daily short-term trend (1.1574) provides support, then the breakdown of the lower border of the weekly cloud, which has slightly changed its position today and is at the level of 1.1558, will have a value. If the bears are able to go beyond the area of 1.1574-58 and consolidate in the bearish zone relative to the weekly cloud, then all their future plans will be related to the struggle and breaking through the monthly borders.
The area of 1.1516 - 1.1494 (the upper limit of the monthly cloud + the monthly medium-term trend) will be the first target of the bears, and the second one is the monthly level of 1.1447 (the lower limit of the monthly level). As for the bulls, the nearest and most important level in the current conditions is set at the resistance zone of 1.1664 - 1.1695 - 1.1716 (historical level + monthly Fibo Kijun + weekly Tenkan + levels of the daily Ichimoku cross).
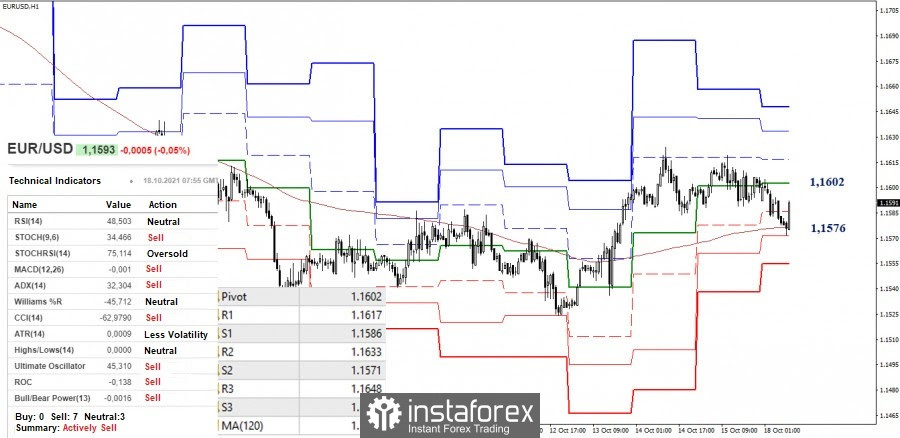
The bulls in the smaller timeframes have been in the correction zone for quite some time, but at the same time, they still manage to retain the most significant support here – the weekly long-term trend (1.1576), which is now strengthened by the daily short-term trend. However, a sharp consolidation below will change the current balance of power. The nearest support to further decline will be the level of 1.1555 (S3).
On the contrary, maintaining the weekly long-term trend on the bullish side and the restoration of their positions will allow the pair to test first the central pivot level (1.1602), and then update the high (1.1624). Other intraday upward targets are located at 1.1633 and 1.1648 (classic pivot levels) today.
GBP/USD
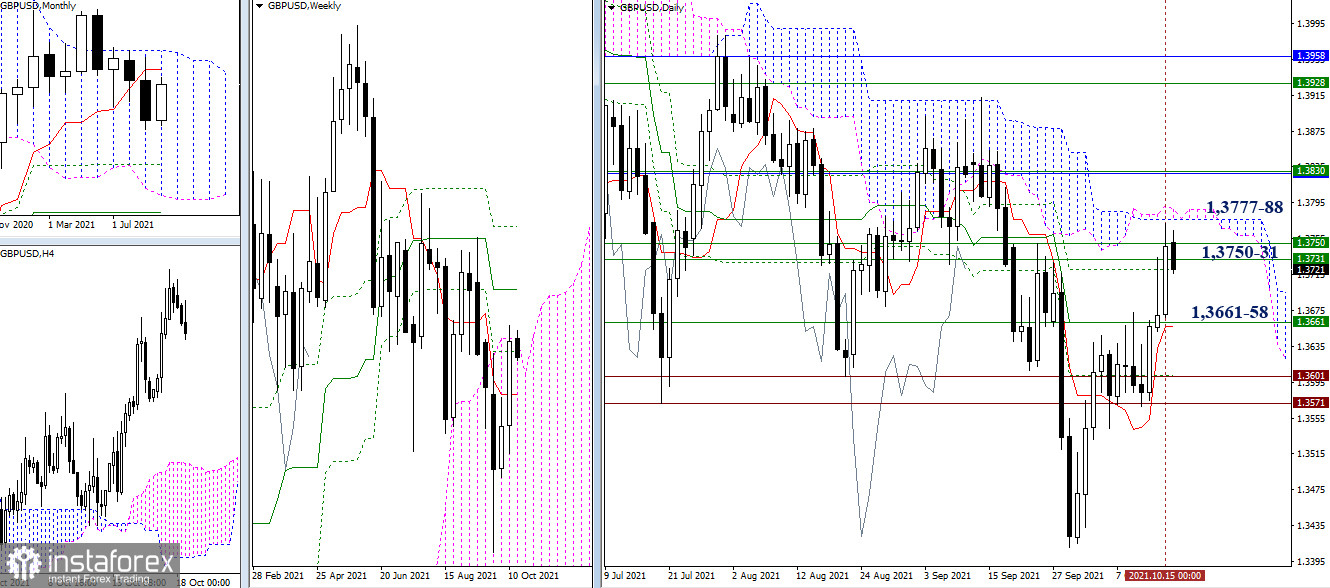
Closing the previous week, bullish traders brought the pair to the important resistance levels of 1.3731-50 (consolidation of weekly levels). If they successfully break through it, they can conquer the daily cloud (1.3777-88) and the border of 1.3830 (weekly medium-term trend + monthly short-term trend). But in the case of the formation of a rebound during the current testing of 1.3731-50, one can expect a decline in the pound to the previously broken pivot points of 1.3661 - 1.3658 (daily Tenkan + weekly Tenkan) and 1.3601 - 1.3571 (historical levels + daily Fibo Kijun).
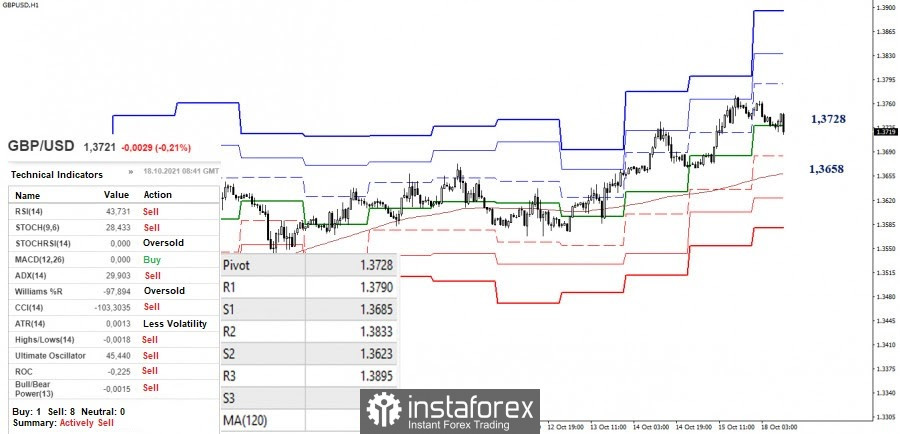
The main advantage in the smaller timeframes currently belongs to the bulls. The resistance of the classic pivot levels 1.3790 - 1.3833 - 1.3895 serves as pivot points for them today. However, despite the main advantage, the pair is now in the correction zone, and the analyzed technical indicators have tuned in to support the bears.
The next, most important towards the development of bearish sentiments, is the border of the weekly long-term trend (1.3658). The nearest support can now be noted at 1.3685 (S1). It should be noted that the breakdown of the level of 1.3658, a reliable consolidation below, and a reversal of the moving average will be able to change the current balance of power in the lower period. At the same time, it would be better to reevaluate the situation and new prospects.
***
Ichimoku Kinko Hyo (9.26.52) and Kijun-sen levels in the higher time frames, as well as classic Pivot Points and Moving Average (120) on the H1 chart, are used in the technical analysis of the trading instruments.
*El análisis de mercado publicado aquí tiene la finalidad de incrementar su conocimiento, más no darle instrucciones para realizar una operación.
¡Los informes analíticos de InstaSpot lo mantendrá bien informado de las tendencias del mercado! Al ser un cliente de InstaSpot, se le proporciona una gran cantidad de servicios gratuitos para una operación eficiente.


