


¡La leyenda en el equipo de InstaSpot!
¡Leyenda! ¿Cree que es una retórica grandilocuente? Pero, ¿cómo deberíamos llamar a un hombre, que se convirtió en el primer asiático en ganar el campeonato mundial de ajedrez júnior a los 18 años y en el primer Gran Maestro indio a los 19 años? Ese fue el comienzo de un camino difícil hacia el título de Campeón del Mundo para Viswanathan Anand, el hombre que se convirtió en parte de la historia del ajedrez para siempre. ¡Ahora una leyenda más en el equipo de InstaSpot!


Borussia es uno de los clubes de fútbol con más títulos en Alemania, que ha demostrado repetidamente a los fanáticos: el espíritu de competencia y liderazgo que ciertamente conducirán al éxito. Opere de la misma manera que los profesionales del deporte: con confianza y de forma activa. ¡Mantenga un "pase" del Borussia FC y lidere con InstaSpot!
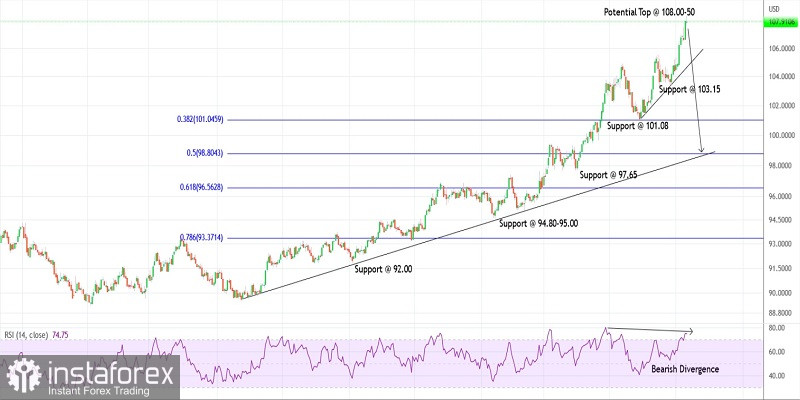
The US dollar index rose through fresh swing highs close to 108.30 during the Europe session on Tuesday. The index is quickly pulling back and is trading close to 108.90 at this point in writing. A major trade cycle that started from 89.20 on January 06, 2021, looks complete at 108.30 as bears are ready to come back in control.
The US dollar index has carved a major upswing between 89.20 and 108.30 as it hits a strong resistance zone. The potential remains for a bearish reaction here that could drag prices lower towards the 101.00 support at least. Also, note that the Fibonacci 0.382 retracement also passes through 101.00 as projected on the daily chart.
The US dollar index is supported at around 103.15 as well and a break there would be seen as the initial sign of a potential trend reversal ahead. Bears are also creating a potential pinbar/shooting star candlestick pattern. If successful, the next big move would be lower towards 101.00 at least. The possibility remains for a further drag towards 96.50 as well.
The US dollar index needs to produce a meaningful larger-degree retracement after terminating a religious 18-month rally between 89.20 and 108.30. Furthermore, the recent rally towards 108.30 has also been accompanied by bearish divergence on the daily RSI as seen on the chart here. A strong possibility remains for a turn from here.
Potential drop towards 101.00 against 109.00
Good luck!
*El análisis de mercado publicado aquí tiene la finalidad de incrementar su conocimiento, más no darle instrucciones para realizar una operación.
¡Los informes analíticos de InstaSpot lo mantendrá bien informado de las tendencias del mercado! Al ser un cliente de InstaSpot, se le proporciona una gran cantidad de servicios gratuitos para una operación eficiente.


