


¡La leyenda en el equipo de InstaSpot!
¡Leyenda! ¿Cree que es una retórica grandilocuente? Pero, ¿cómo deberíamos llamar a un hombre, que se convirtió en el primer asiático en ganar el campeonato mundial de ajedrez júnior a los 18 años y en el primer Gran Maestro indio a los 19 años? Ese fue el comienzo de un camino difícil hacia el título de Campeón del Mundo para Viswanathan Anand, el hombre que se convirtió en parte de la historia del ajedrez para siempre. ¡Ahora una leyenda más en el equipo de InstaSpot!


Borussia es uno de los clubes de fútbol con más títulos en Alemania, que ha demostrado repetidamente a los fanáticos: el espíritu de competencia y liderazgo que ciertamente conducirán al éxito. Opere de la misma manera que los profesionales del deporte: con confianza y de forma activa. ¡Mantenga un "pase" del Borussia FC y lidere con InstaSpot!

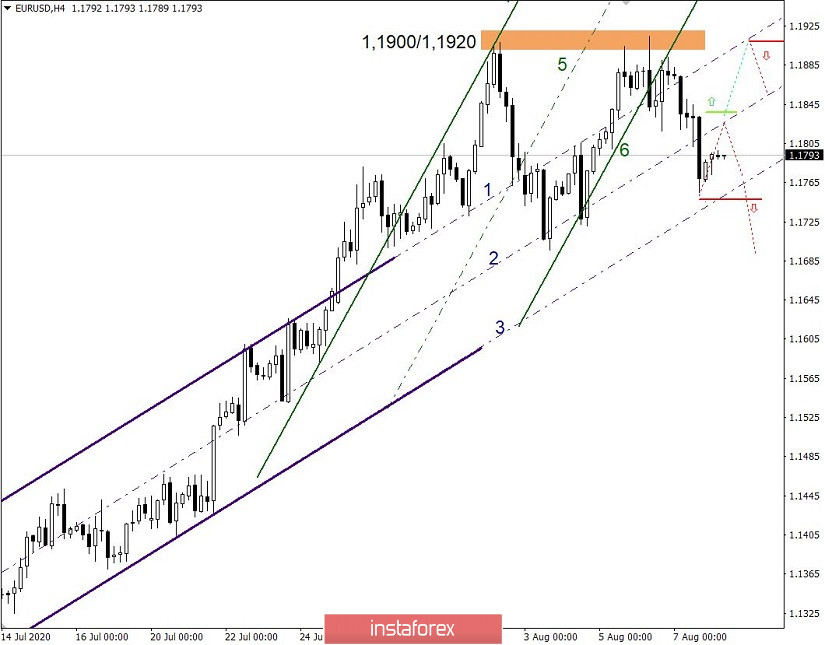
The EUR/USD currency pair resumed movement within trend lines 1, 2 and 3 after resistance was found within the price area 1.1900/1.1920. Based on the resistance point, Friday was built on a downward wave, during which market participants managed not only to rebound from the 1.1900/1.1920 area, but to form a full-fledged move towards trend line No. 3 (1.1755), where a pivot was found.
Following the path of the trend lines allows the trader to prepare in advance for a rebound and reversal in the market, as happened with line # 3, where the pivot point was found.
Considering the current situation in the market with respect to trend lines, we can see that after the price from line # 3 (area 1.1755) can bring the quote within the value 1.1830, where trend line # 2 is located, the main work begins here. The ascending channel (1 + 2 + 3) has existed on the market for a long time, and its further structure cannot be ruled out. A price consolidation above trend line 2 (area 1.1830/1.1840) may lead to a move towards line number 1, where there is also resistance, expressed in the price area 1.1900/1.1920.
An alternative scenario is considering a channel reversal from ascending to descending. In this outcome, trend line 3 (area 1.1740/1.750) plays the main role, since traders will receive a sell signal in case of its breakout.
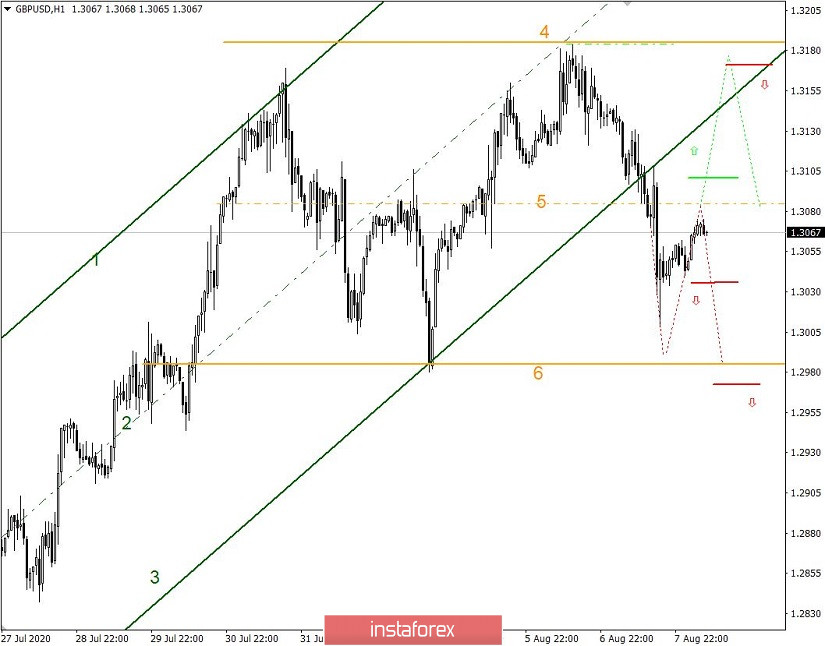
The GBP/USD currency pair changed the structure of the ascending channel of trend lines 1, 2 and 3 for the first time in a long time, where the quote managed to overcome line No. 3 (area 1.3100) last Friday. This market move led to the formation of a new channel and new trend lines.
The side channel in the structure of trend lines 4, 5 and 6 has a number of confirmations on the history of the trading chart, which allows traders to see the price interaction points in advance.
Based on the path of the current move, from trend line 6 (area 1.3000) to the side of line 5 (area 1.3080/1.3090), a number of scenarios can be assumed that can be referred to in trading.
The first scenario proceeds from the price movement along the path 6 ---> 4 (trend lines), where line 5 will not become an obstacle and the quote will be able to consolidate above the value of 1.3100, which will enable traders to enter buy positions.
The second scenario is based on Friday's downward trend, on the basis of which the market changed direction. In this case, a price rebound from trend line #5 can return the quote within the pivot point 1.3000.
In such scenario, the best entry point is below 1.3035, towards 1.3000.
*El análisis de mercado publicado aquí tiene la finalidad de incrementar su conocimiento, más no darle instrucciones para realizar una operación.
¡Los informes analíticos de InstaSpot lo mantendrá bien informado de las tendencias del mercado! Al ser un cliente de InstaSpot, se le proporciona una gran cantidad de servicios gratuitos para una operación eficiente.


