


¡Nuestro equipo cuenta con más de 7,000,000 operadores!
Cada día, trabajamos juntos para mejorar las operaciones. Obtenemos grandes resultados y seguimos adelante.
El reconocimiento de millones de operadores en todo el mundo es el mejor agradecimiento a nuestro trabajo! ¡Usted hizo su elección y haremos todo lo que esté a nuestro alcance para satisfacer sus expectativas!
¡Juntos somos un gran equipo!
InstaSpot. ¡Orgulloso de trabajar para usted!


¡Actor, 6 veces ganador del torneo UFC y un verdadero héroe!
El hombre que se hizo a sí mismo. El hombre que sigue nuestro camino.
El secreto detrás del éxito de Taktarov es el constante movimiento hacia el objetivo.
¡Revele todo los lados de su talento!
Descubra, intente, fracase, ¡pero nunca se rinda!
InstaSpot. ¡Su historia de éxito comienza aquí!
To open long positions on GBP/USD, you need:
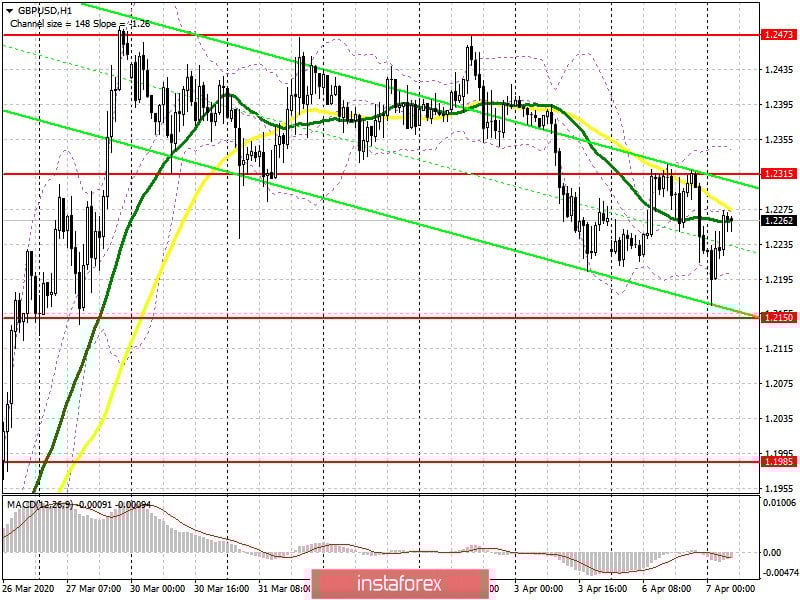
News that the condition of British Prime Minister Boris Johnson has deteriorated caused the pound to fall yesterday afternoon. Let me remind you that the prime minister was infected with coronavirus. However, the bulls managed to protect the support of 1.2150, which kept the pair in the side channel. Today, buyers need to urgently return the pair back to the level of 1.2315 in the first half of the day, which they failed to do yesterday, since only in this scenario will they be able to retain the advantage. Consolidating above this range will open a direct path to last week's high in the 1.2473 area, where I recommend taking profits. If the decline in GBP/USD continues amid the absence of fundamental statistics, it is best to return to long positions only after the support test of 1.2150, provided that a false breakout is formed there, or a rebound from the larger low of 1.1985, based on a correction of 60-70 within the day.
To open short positions on GBP/USD, you need:
Bears still control the market, showing themselves at every opportunity. Today, you can return to short positions only after an upward correction to the resistance of 1.2355, provided that a false breakout is formed there, which will be a signal to sell the pound in order to update the larger lows of 1.2150 and 1.1985, where I recommend taking profits. If the bears prefer to retreat again, as evidenced by the lack of active sales after a false breakout in the resistance area of 1.2315, then I recommend returning to short positions only for a rebound from last week's high in the 1.2473 area.
Signals of indicators:
Moving averages
Trade is conducted in the range of 30 and 50 moving averages, which indicates market uncertainty in the short term.
Note: The period and prices of moving averages are considered by the author on the hourly chart H1 and differs from the general definition of the classic daily moving averages on the daily chart D1.
Bollinger bands
A break of the upper boundary of the indicator at 1.2320 will lead to a larger growth of the pound. Breakout of the lower boundary in the region of 1.2200 will increase the pressure on the pair.
Description of indicators
*El análisis de mercado publicado aquí tiene la finalidad de incrementar su conocimiento, más no darle instrucciones para realizar una operación.
¡Los informes analíticos de InstaSpot lo mantendrá bien informado de las tendencias del mercado! Al ser un cliente de InstaSpot, se le proporciona una gran cantidad de servicios gratuitos para una operación eficiente.


