




Naš tim čini više od 7.000.000 trgovaca!
Svakog dana zajedno radimo na unapređenju trgovanja. Ostvarujemo vrhunske rezultate i krećemo se samo napred.
Priznatost od strane miliona trgovaca širom sveta najbolje pokazuje koliko se naš rad ceni! Napravili ste svoj izbor i mi ćemo učiniti sve što je neophodno da zadovoljimo vaša očekivanja!
Zajedno činimo sjajan tim!
InstaSpot. Sa ponosom radi za Vas!





Glumac, šampion UFC turnira i pravi heroj!
Čovek koji je ostvario sebe. Čovek koji hoda uz nas.
Tajna uspeha Taktarova jeste stalno kretanje ka svom cilju.
Otkrijte sve strane svog talenta!
Istražuj, pokušaj, padni - ali se nikad ne zaustavljaj!
InstaSpot. Priča Vašeg uspeha započinje ovde!

If the White House does not stand in the way of artificial intelligence, it's time to buy stocks tied to that theme again. The Nasdaq Composite and the Magnificent Seven closed at record highs, and the S&P 500 delivered its best one-day gain since August after Donald Trump said he does not want to restrict what he called a development bigger than the Industrial Revolution and the Internet.
Nasdaq Composite and Magnificent Seven dynamics
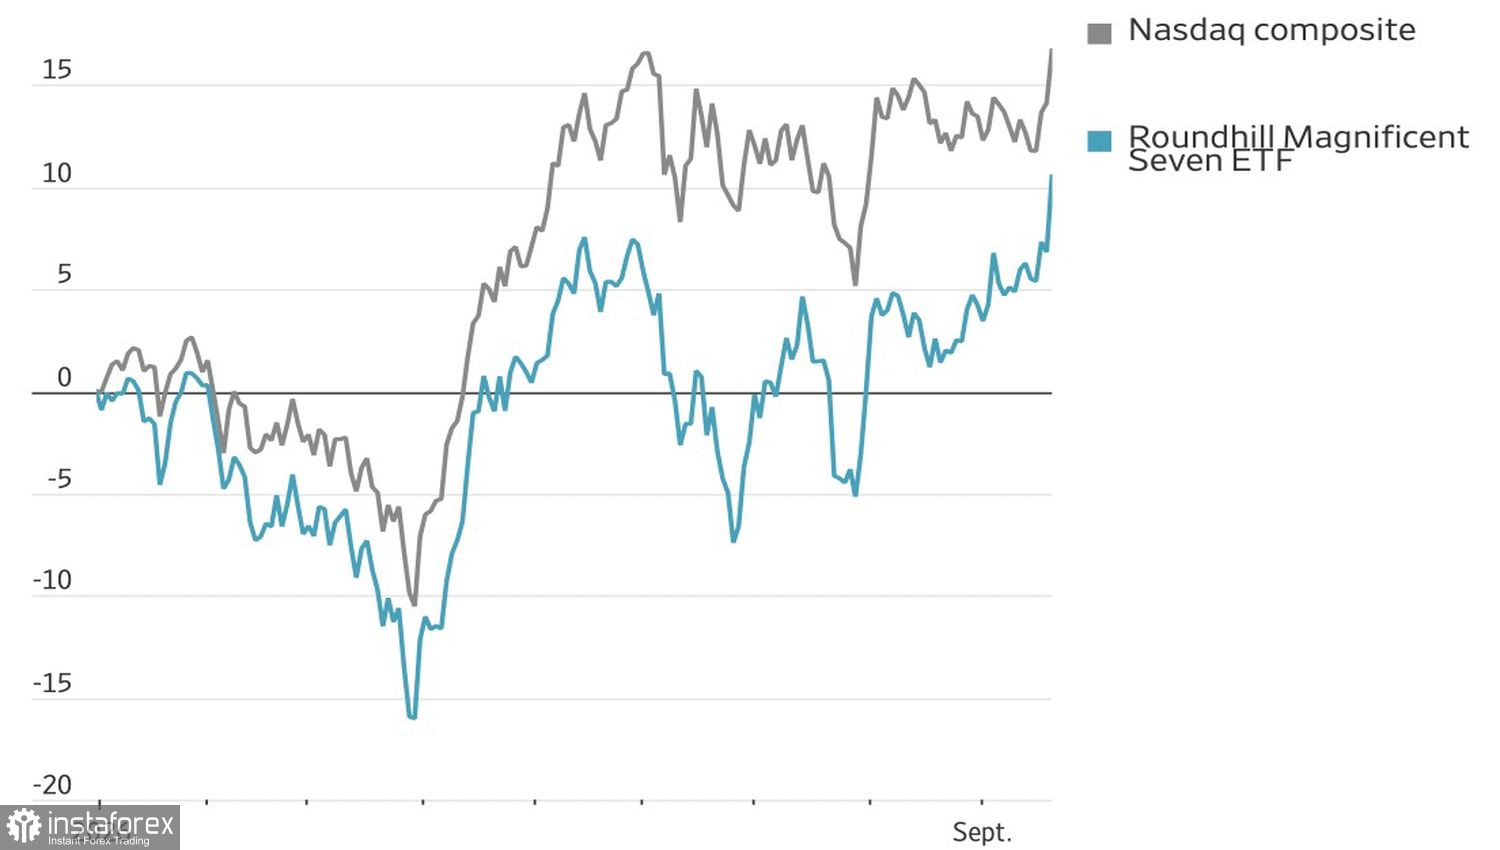
The US equity rally impressed, but it is not broad-based. Comparing the S&P 500 with a market-cap-weighted index makes that clear. Leading the move was not only what market participants called "Trump's put," but also Meta Platforms, which released a new AI agent that quickly topped usage rankings. The company's market cap rose by $192 billion, marking the biggest single-day gain in over a year.
Investors snapped up shares of companies tied to new technologies like hotcakes, and combined with the White House's supportive tone, this points to a renewed AI boom. The S&P 500 drew within striking distance of its record highs. It's worth noting that the rally took place against a favorable external backdrop — oil prices and Treasury yields were falling.
Rumors of a meeting between the US and Iranian presidents at the UN summit revived hopes of renewed diplomacy. Together with Saudi Arabia ramping oil exports through the Strait of Hormuz, this pushed Brent down for four straight sessions. Treasuries reacted with lower yields, since the retreat in the North Sea benchmark reduces the risk of an inflation surge and an aggressive Fed tightening.
S&P 500 P/E ratio and financial conditions
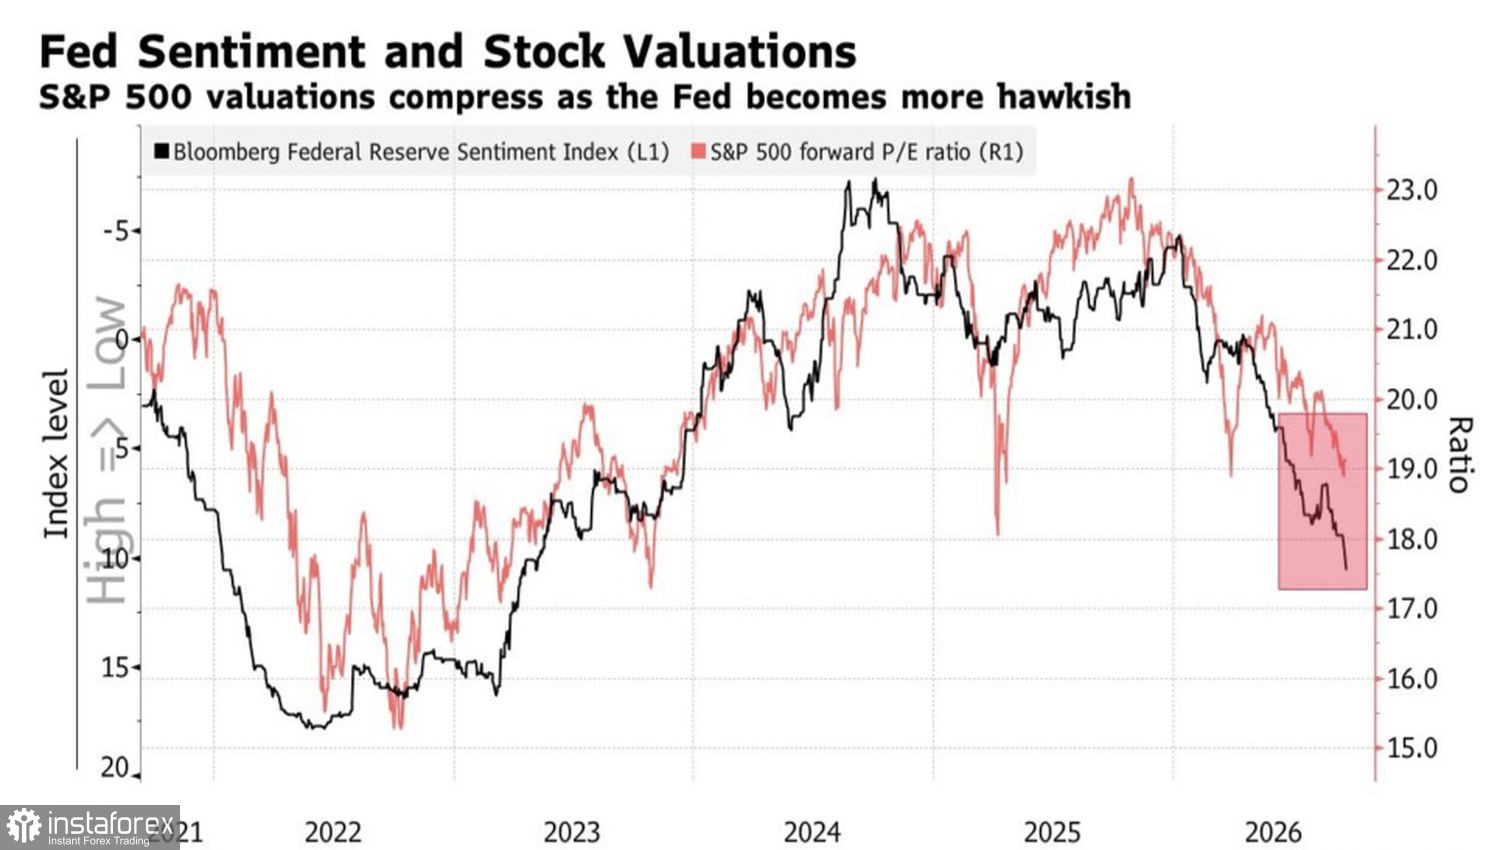
Oil and Treasury yields are critically important for equity indices. Morgan Stanley warns that their further rise could trigger a 7% correction in the S&P 500. The bank highlights the heightened sensitivity of forward-earnings multiples to tightening financial conditions amid rate hike expectations.
In sum, the S&P 500's push toward record highs is the product of several factors: a return of the AI boom thanks to Trump's put or the administration's unwillingness to impede new technologies; falling Treasury yields; and lower oil prices. Together, these forces have pushed investors out of fear and back into greed. The question is: for how long?
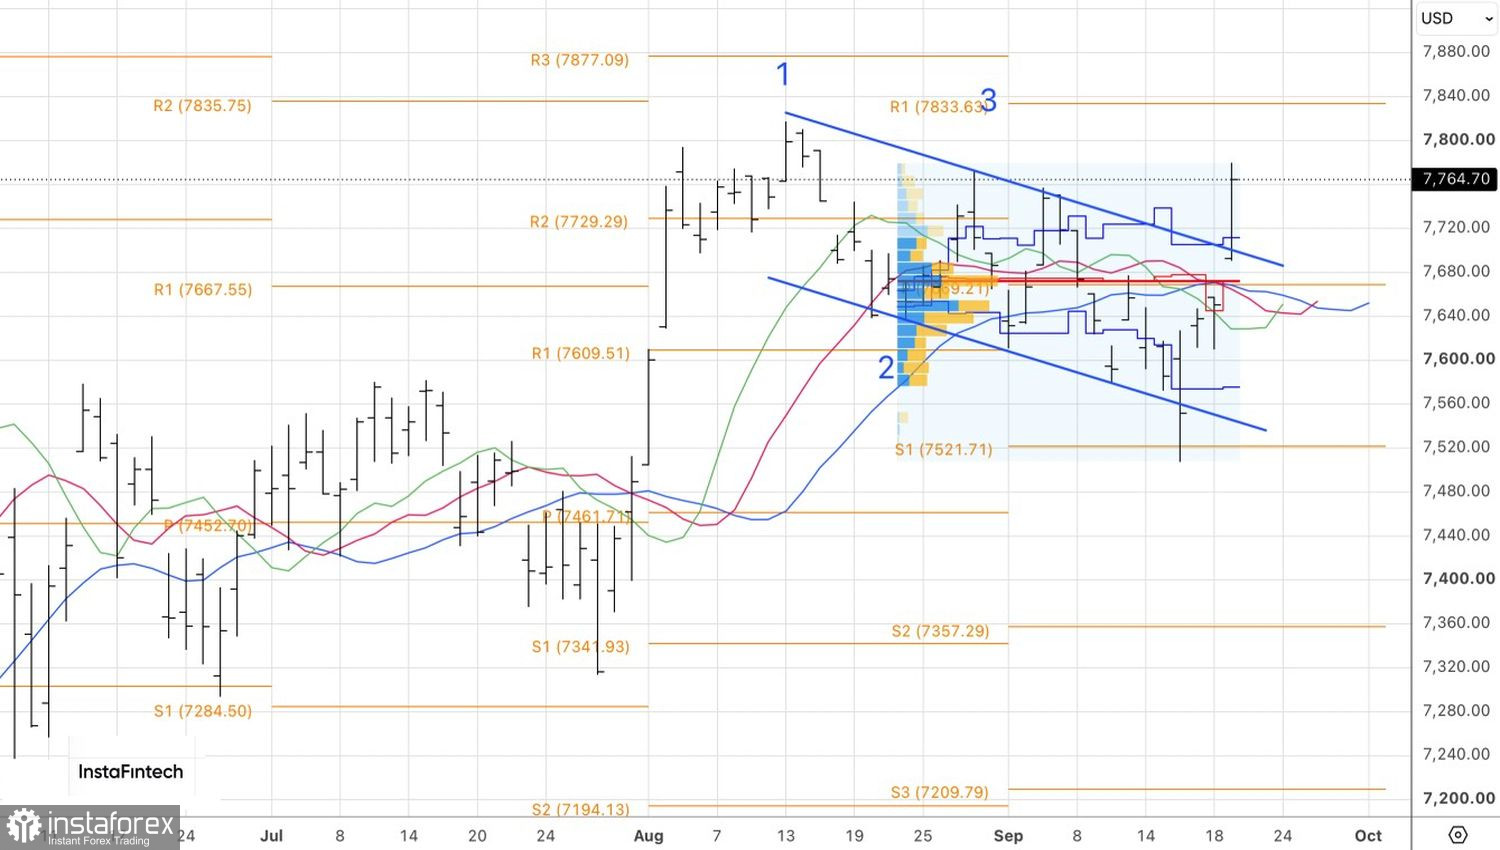
Technically, the daily chart shows that the S&P 500 has broken above the upper boundary of the descending channel, signaling that the 1-2-3 reversal pattern failed and that the uptrend is likely to resume. Long positions taken from the lower boundary should be held and scaled. Target levels to watch are 7,830 and 7,980.
*Analiza tržišta koja se ovde nalazi namenjena je boljem razumevanju tržišta i ne pruža instrukcije za vršenje trgovanja.
Uz InstaSpot-ove analitičke preglede uvek ćete biti u toku sa tržišnim trendovima! Klijentima InstaSpot-a su dostupni mnogobrojni besplatni servisi za uspešno trgovanje.


