


The legend in the InstaSpot team!
Legend! You think that's bombastic rhetoric? But how should we call a man, who became the first Asian to win the junior world chess championship at 18 and who became the first Indian Grandmaster at 19? That was the start of a hard path to the World Champion title for Viswanathan Anand, the man who became a part of history of chess forever. Now one more legend in the InstaSpot team!


Borussia is one of the most titled football clubs in Germany, which has repeatedly proved to fans: the spirit of competition and leadership will certainly lead to success. Trade in the same way that sports professionals play the game: confidently and actively. Keep a "pass" from Borussia FC and be in the lead with InstaSpot!

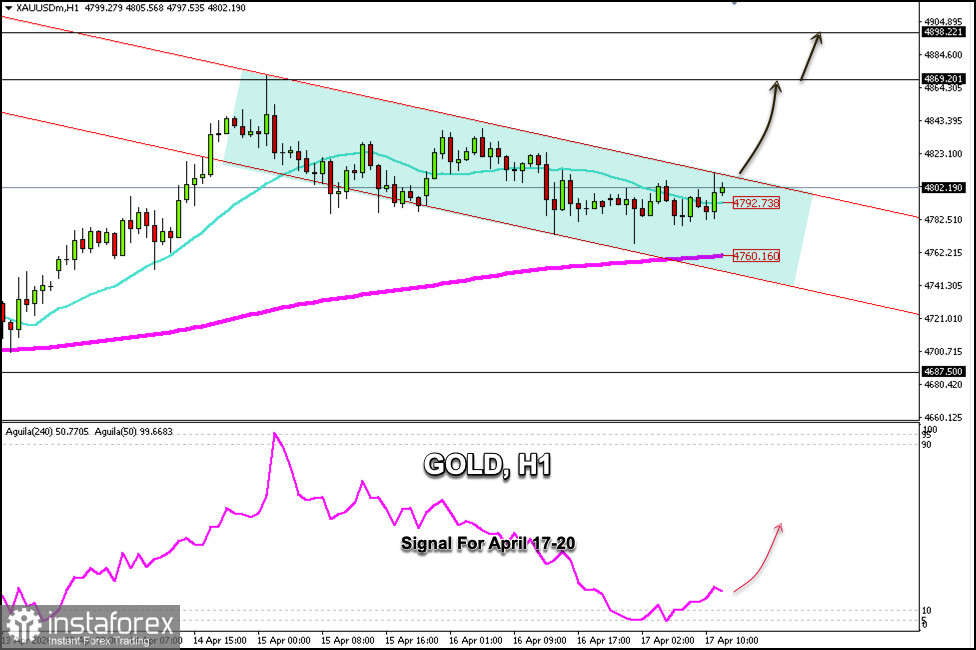
Gold is trading around $4,802 within a bearish trend channel on the H1 chart that has been forming since April 14. The chart shows that gold is consolidating above the 200-period EMA at $4,760, suggesting that gold could see a recovery in the coming days, potentially reaching the R_3 resistance level at $4,898.
Looking at the H1 chart, gold is above the 21SMA and is testing the strong resistance of the downtrend channel. Technically, XAU/USD appears to be forming a bullish pennant pattern on the H4 chart. If the price consolidates above $4,800, we could expect it to reach $4,869 and $4,900 in the coming hours.
Conversely, if gold fails to break above $4,800, we could expect a correction toward the 200 EMA at $4,760, and we could anticipate a technical bounce in this area.
The Eagle indicator is showing a positive signal, hence gold is likely to continue rising in the coming hours. Therefore, we will use this technical analysis to buy above the 21 SMA at $4,792 or above $4,760, as both levels offer a positive outlook for gold in the coming hours.
*Analiza tržišta koja se ovde nalazi namenjena je boljem razumevanju tržišta i ne pruža instrukcije za vršenje trgovanja.
Uz InstaSpot-ove analitičke preglede uvek ćete biti u toku sa tržišnim trendovima! Klijentima InstaSpot-a su dostupni mnogobrojni besplatni servisi za uspešno trgovanje.


