


Naš tim čini više od 7.000.000 trgovaca!
Svakog dana zajedno radimo na unapređenju trgovanja. Ostvarujemo vrhunske rezultate i krećemo se samo napred.
Priznatost od strane miliona trgovaca širom sveta najbolje pokazuje koliko se naš rad ceni! Napravili ste svoj izbor i mi ćemo učiniti sve što je neophodno da zadovoljimo vaša očekivanja!
Zajedno činimo sjajan tim!
InstaSpot. Sa ponosom radi za Vas!


Glumac, šampion UFC turnira i pravi heroj!
Čovek koji je ostvario sebe. Čovek koji hoda uz nas.
Tajna uspeha Taktarova jeste stalno kretanje ka svom cilju.
Otkrijte sve strane svog talenta!
Istražuj, pokušaj, padni - ali se nikad ne zaustavljaj!
InstaSpot. Priča Vašeg uspeha započinje ovde!

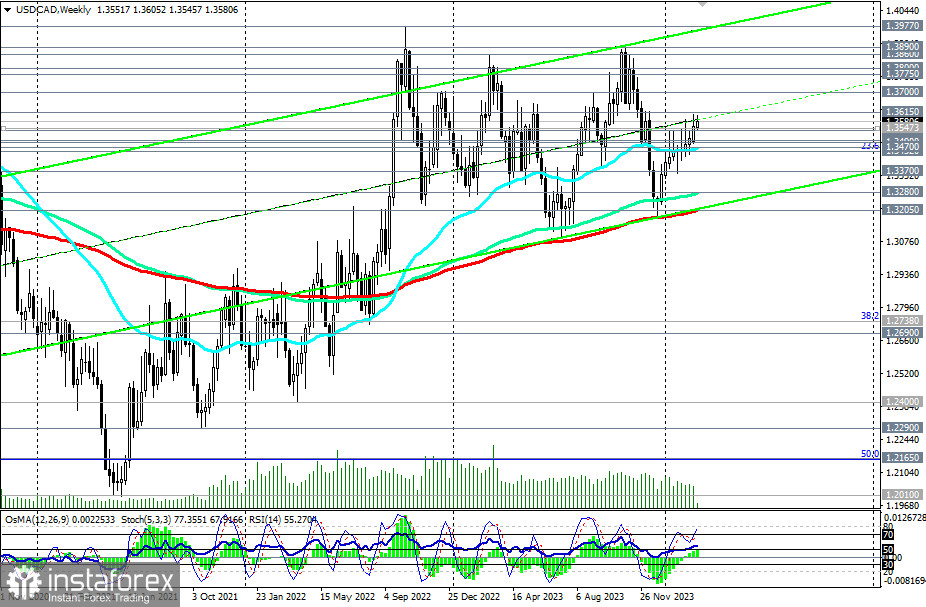
Having overcome the resistance zone around the 1.3500 mark last month, USD/CAD continues to demonstrate positive dynamics in March, moving within upward channels on daily and weekly charts.
Now, the nearest resistance is located at the 1.3600 mark, through which the upper line of the upward channel on the daily chart passes.
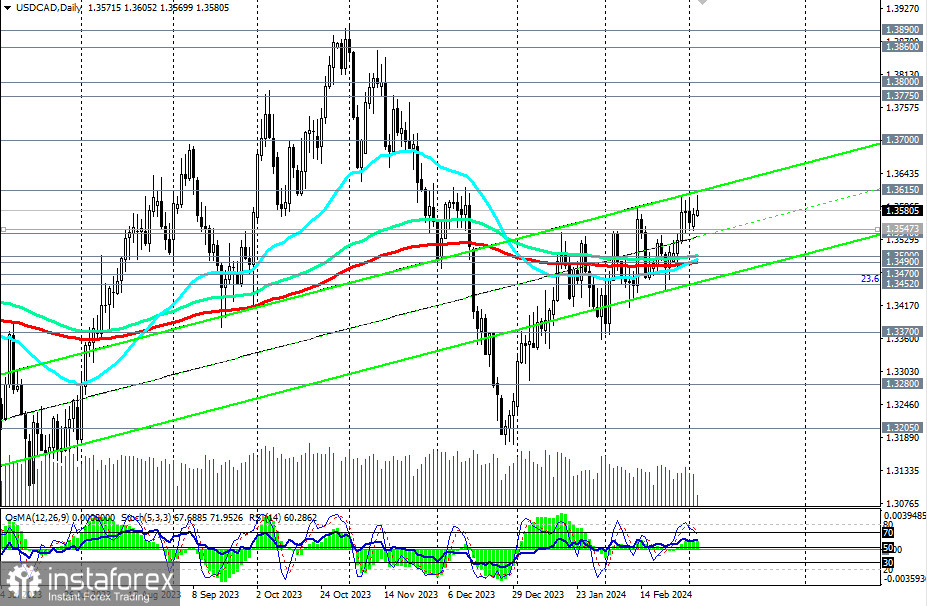
In the event of breaking through the said level, USD/CAD will head towards the upper boundary of the upward channel on the weekly chart and the highs of October–November of the previous year, near the 1.3900 mark. Intermediate targets, in this case, will be located near the marks 1.3700, 1.3780, 1.3800, and 1.3860.
In an alternative scenario, a decline of the pair within the aforementioned upward channels and towards key supports at levels 1.3500 and 1.3490 may resume.
Their breakthrough and the breach of the important support level of 1.3452 (23.6% Fibonacci correction level in the growth wave from the level of 0.9700 to the level of 1.4600, reached in June 2016) will return USD/CAD to the medium-term bearish market zone.
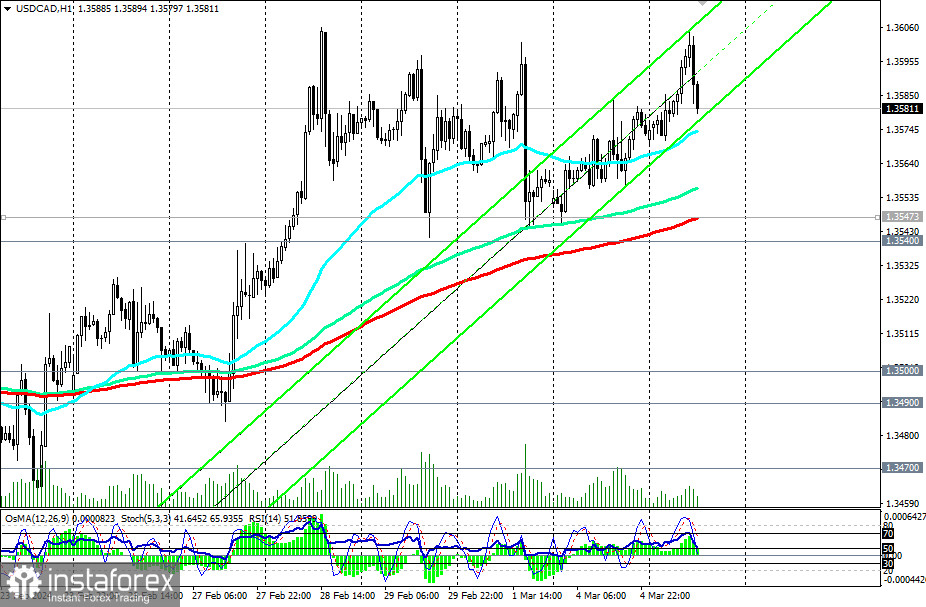
The first signal for the implementation of this scenario may be the breakthrough of today's low of 1.3570, and the confirming signal will be the breakthrough of the short-term support level of 1.3547 (200 EMA on the 1-hour chart).
Support levels: 1.3570, 1.3547, 1.3540, 1.3500, 1.3490, 1.3470, 1.3452, 1.3400, 1.3370, 1.3300, 1.3280, 1.3205
Resistance levels: 1.3600, 1.3615, 1.3700, 1.3775, 1.3800, 1.3860, 1.3890, 1.3900, 1.3970, 1.4000
Trading scenarios
Main scenario: Buy at the market, Buy Stop 1.3620. Stop-Loss 1.3560. Targets 1.3700, 1.3775, 1.3800, 1.3860, 1.3890, 1.3900, 1.3970, 1.4000
Alternative scenario: Sell Stop 1.3560. Stop-Loss 1.3620. Targets 1.3550, 1.3540, 1.3500, 1.3490, 1.3470, 1.3452, 1.3400, 1.3370, 1.3300, 1.3280, 1.3200
"Targets" correspond to support/resistance levels. This also does not mean that they will necessarily be reached, but they can serve as a guide when planning and placing trading positions.
*Analiza tržišta koja se ovde nalazi namenjena je boljem razumevanju tržišta i ne pruža instrukcije za vršenje trgovanja.
Uz InstaSpot-ove analitičke preglede uvek ćete biti u toku sa tržišnim trendovima! Klijentima InstaSpot-a su dostupni mnogobrojni besplatni servisi za uspešno trgovanje.


