


Naš tim čini više od 7.000.000 trgovaca!
Svakog dana zajedno radimo na unapređenju trgovanja. Ostvarujemo vrhunske rezultate i krećemo se samo napred.
Priznatost od strane miliona trgovaca širom sveta najbolje pokazuje koliko se naš rad ceni! Napravili ste svoj izbor i mi ćemo učiniti sve što je neophodno da zadovoljimo vaša očekivanja!
Zajedno činimo sjajan tim!
InstaSpot. Sa ponosom radi za Vas!


Glumac, šampion UFC turnira i pravi heroj!
Čovek koji je ostvario sebe. Čovek koji hoda uz nas.
Tajna uspeha Taktarova jeste stalno kretanje ka svom cilju.
Otkrijte sve strane svog talenta!
Istražuj, pokušaj, padni - ali se nikad ne zaustavljaj!
InstaSpot. Priča Vašeg uspeha započinje ovde!

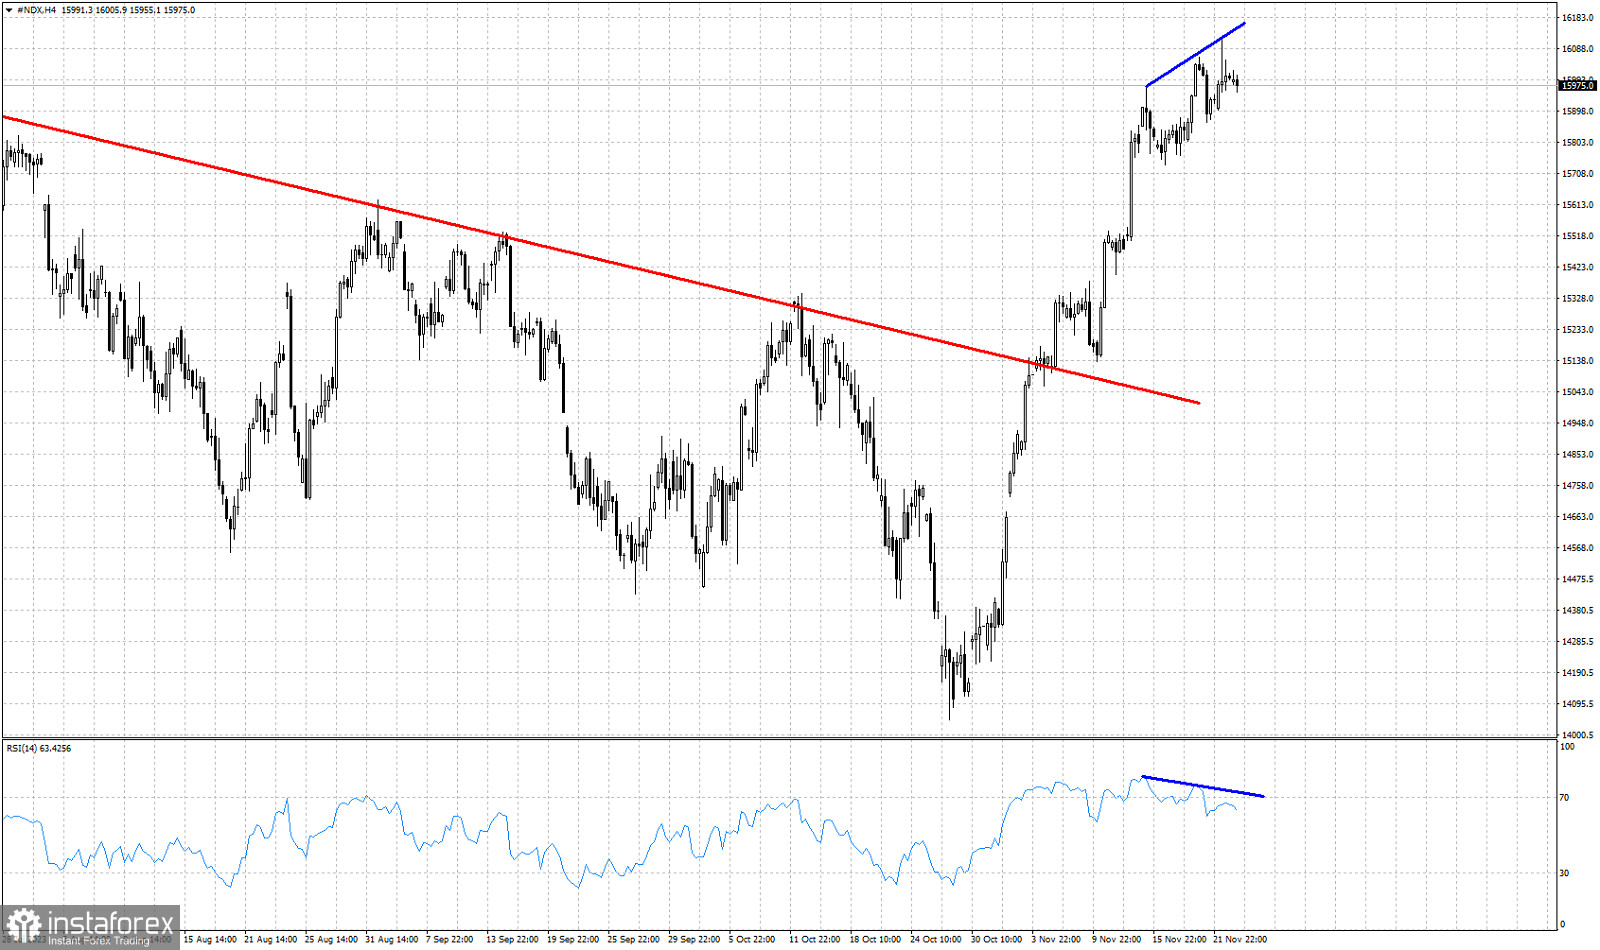
Red line -resistance trend line (broken)
Blue lines- RSI bearish divergence signs.
Nasdaq is trading around 15,970. There are increased chances that the top is in and we are at the early stages of a reversal. Technically trend remains bullish as price continues making higher highs and higher lows. The RSI is making lower highs providing us with bearish divergence signs. The index has made an impressive almost vertical rise during the last 30 days breaking above key resistance trend line. At current levels we believe that it is more probable for price to make at least a pull back to back test the broken trend line. The RSI has provided us with a first warning. A break below 15,860 will be our first sell signal if and when it comes.
*Analiza tržišta koja se ovde nalazi namenjena je boljem razumevanju tržišta i ne pruža instrukcije za vršenje trgovanja.
Uz InstaSpot-ove analitičke preglede uvek ćete biti u toku sa tržišnim trendovima! Klijentima InstaSpot-a su dostupni mnogobrojni besplatni servisi za uspešno trgovanje.


