




انسٹا فاریکس ٹیم میں لیجنڈ!
لیجنڈ!آپ کو لگتا ہے کہ یہ حیرت انگیز بیانات ہے؟ لیکن ہمیں ایسے شخص کو کیا کہنا چاہئے ، جو 18 سال میں جونیئر ورلڈ شطرنج چیمپئن شپ جیتنے والا پہلا ایشین بن گیا تھا اور 19 میں پہلا ہندوستانی گرینڈ ماسٹر بنا؟ ورلڈ چیمپیئن ٹائٹل کے لئے یہ مشکل آغاز تھا جو وشونااتھ آنند کے لئے تھا ، وہ شخص جو ہمیشہ کے لئے شطرنج کی تاریخ کا حصہ بن گیا تھا۔ انسٹا فاریکس ٹیم میں اب ایک اور لیجنڈ!





Borussia is one of the most titled football clubs in Germany, which has repeatedly proved to fans: the spirit of competition and leadership will certainly lead to success. Trade in the same way that sports professionals play the game: confidently and actively. Keep a "pass" from Borussia FC and be in the lead with InstaSpot!

The wave structure on the 4-hour chart for the EUR/USD instrument is becoming more complex. There is still no talk of canceling the upward segment of the trend (see lower image), which began in January of last year; however, the wave structure of the trend has now taken on a corrective form. In the long term, we should expect the formation of wave C, with its low needing to be below the low of wave A. Currently, the low of wave C is below the low of wave A, indicating that wave C could complete at any moment. However, with a favorable news backdrop for the dollar, this wave could take on a much more elongated form.
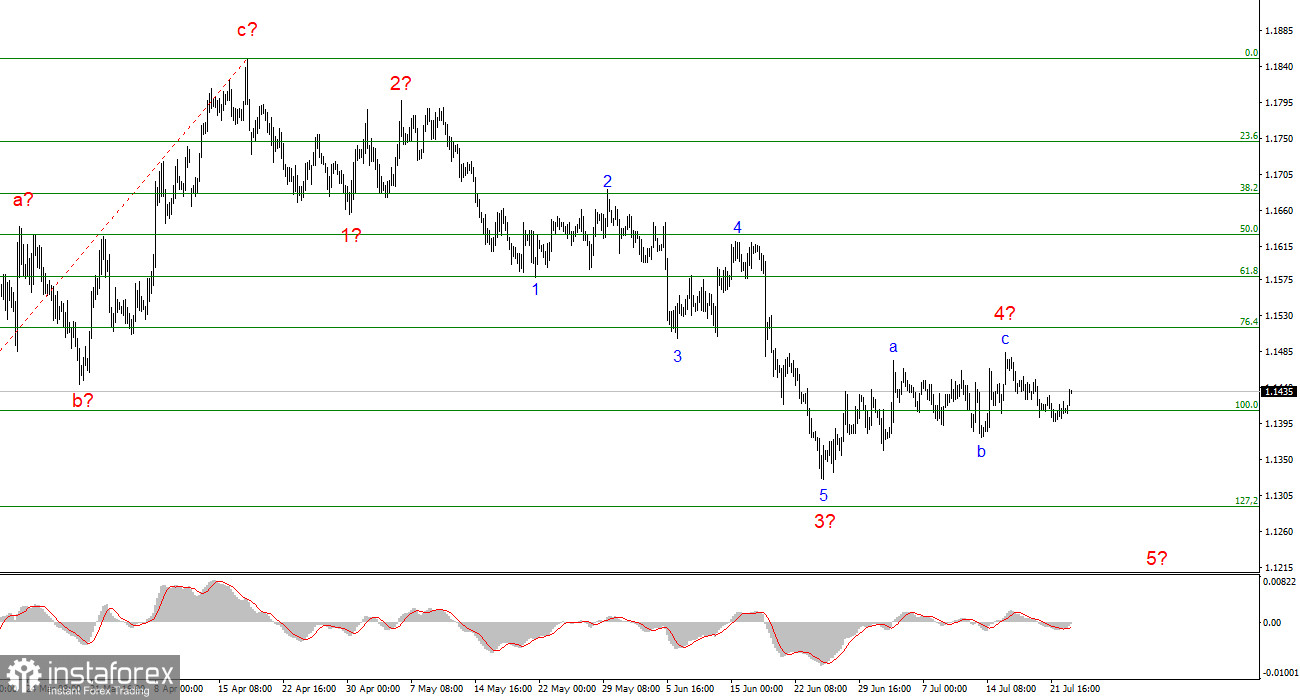
On a smaller scale, I can identify a classic five-wave downward structure. If this assumption is correct, then we are currently in the process of forming wave 4, while wave 3 has taken on a five-wave form. After completing this structure, the instrument may transition to an upward wave sequence. However, according to the current wave analysis, we still expect the formation of wave 5. Therefore, the European currency may dip to the 13 figure.
The EUR/USD exchange rate rose by 15 basis points on Wednesday, although the amplitude of the movements remains minimal. The market continues to see no grounds for buying or selling the European currency, which explains the zero activity of its participants. On Thursday morning, the euro added another 20 pips, which leads me to assume that the formation of wave 4 in C is becoming more complex. If that is indeed the case, the price increase will continue with targets around the 15 figure.
In just a few hours, the results of the European Central Bank meeting will be known. There is no intrigue whatsoever. The probability of a second consecutive round of monetary policy tightening is minimal. It is not zero but minimal. The morning rise of the euro may be linked to this event; however, the movements over the last month have been extremely weak, so a 20-pip rise has not made traders feel either cold or hot. Quite frankly, I expect market reaction only if the ECB unexpectedly raises interest rates. I do not expect anything from Christine Lagarde's speech. If the ECB decides to maintain monetary policy parameters, Lagarde is unlikely to promise a rate hike at the next meeting. Most likely, the ECB president will highlight rising inflation and uncertainty related to geopolitics in the Middle East and oil prices. Surprises are possible today but unlikely.
There will be no other events on Thursday. The European currency remains within the framework of a corrective wave, so I still expect further growth of the US dollar to complete the downward wave formation. After that, I expect at least a corrective wave sequence, which may take several weeks. I do not expect the EUR/USD instrument to fall significantly below the 13 figure. Wave 4 may already be complete.
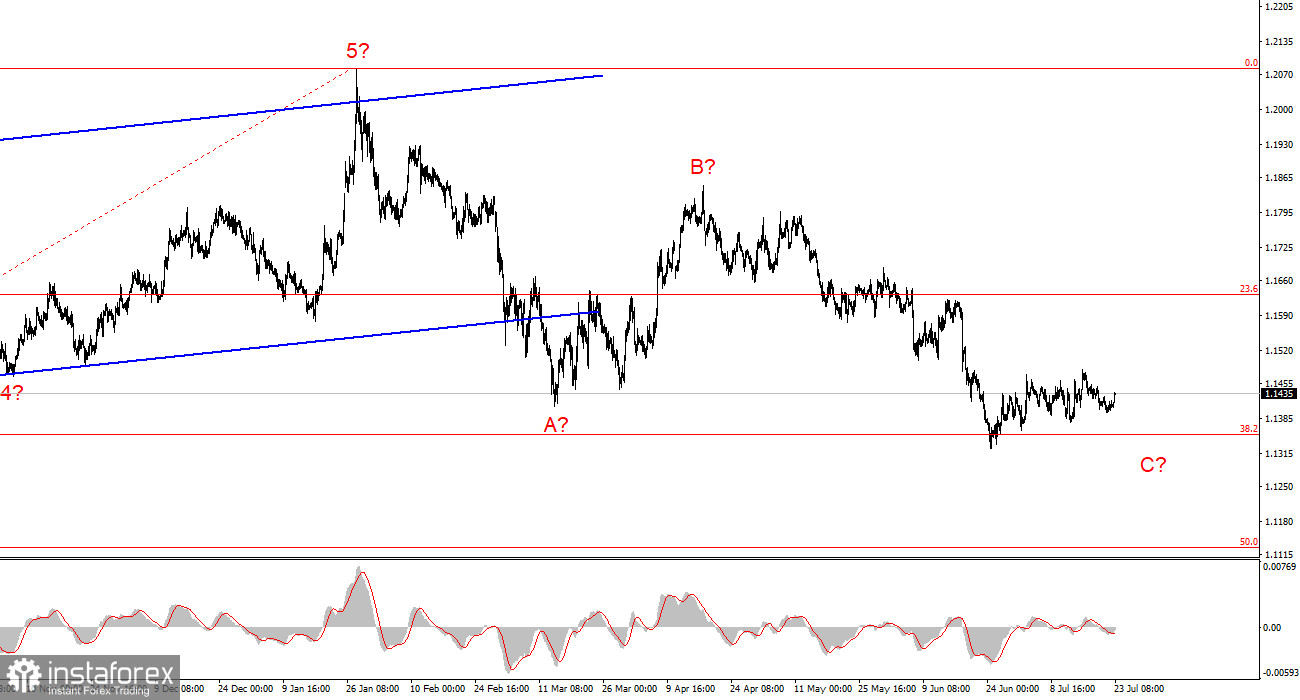
Based on my analysis of EUR/USD, I conclude that the instrument remains within an upward trend segment (see lower image), while in a shorter-term perspective, it is within a downward trend segment. In my opinion, it is a good time to consider opening long positions, but the instrument may still dip to the 13-figure level as part of wave 5 in C. Wave analysis often presents surprises, so I would start to readjust toward buying.
On a larger scale, an upward trend segment is visible, after which a corrective wave sequence began. In the near future, we should expect the formation of wave C with targets located around the 1.1352 mark, which corresponds to 38.2% on the Fibonacci scale. After completing the A-B-C structure, a new long-term upward trend may begin.
*تعینات کیا مراد ہے مارکیٹ کے تجزیات یہاں ارسال کیے جاتے ہیں جس کا مقصد آپ کی بیداری بڑھانا ہے، لیکن تجارت کرنے کے لئے ہدایات دینا نہیں.
InstaSpot analytical reviews will make you fully aware of market trends! Being an InstaSpot client, you are provided with a large number of free services for efficient trading.


