empty
 
 
pk
سپورٹ
فوری اکاونٹ کھولیں
تجارتی پلیٹ فارم
رقم جمع کروانا / نکلوانا

07.07.202608:49 Forex Analysis & Reviews: Cryptocurrency Trading Recommendations for July 7

Relevance up to 02:00 2026-07-08 UTC--4

Bitcoin and Ethereum saw a buying surge yesterday following a noticeable dip; however, this growth did not receive support during today's Asian session, returning trading instruments to a range. Currently, Bitcoin is trading around $63,200, while Ethereum is trying to break above $1,775.

Exchange Rates 07.07.2026 analysis

Meanwhile, investors continue to pull money out of spot Bitcoin ETFs for the eighth consecutive week, with total outflows reaching $8.3 billion. Last week alone saw a net outflow of $526 million, significantly softer than the previous weeks' results, which saw weekly losses of $1.79 billion and $1.72 billion. The slowing rate of outflows, while still negative, resembles a situation we have observed before: the series continues, but the intensity of selling is gradually decreasing. A week earlier, the market even saw a brief inflow day of $221.7 million before outflows resumed.

This eighth consecutive week without any sustained positive results places the current series alongside the longest outflow periods in the history of spot Bitcoin ETFs, surpassing the previous local record of seven weeks and $7.8 billion. It is important to consider the context: during this same period, Bitcoin fell below $58,000, climbed above $62,000 amid weak U.S. labor market data, and has since declined to current levels. Citi has reduced its 12-month Bitcoin forecast to $82,000, while BlackRock has cut its holding by nearly 100,000 coins over the past two months. At the same time, on-chain data shows a contrary trend: long-term holders are accumulating positions at a record pace, with their total balance exceeding 16 million coins.

The slowdown in outflows while maintaining a general negative trend can be interpreted in two ways. On one hand, it may indicate a gradual exhaustion of seller pressure. On the other hand, eight weeks of continuous net outflows, even if slowing, still represent the longest streak of capital flight since the launch of spot Bitcoin ETFs, and for a full reversal to occur, the market will need not just a cessation of selling but a sustained and increasing inflow over several consecutive weeks. Until this happens, many market participants continue to watch the average purchase level of long-term holders around $48,400 as a key line between the completion of the bearish cycle and true capitulation.

As for short-term trading, the strategy and conditions are described below.
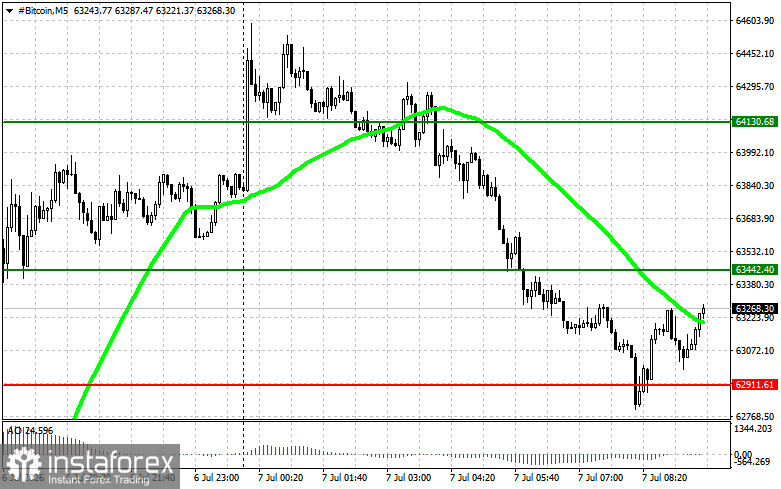
Bitcoin

Exchange Rates 07.07.2026 analysis

Buy Scenario

  • Scenario No. 1: I will buy Bitcoin today upon reaching an entry point around $63,400, targeting a rise to the level of $64,100. At around $64,100, I will exit from buy positions and immediately sell on the bounce. Before buying on a breakout, ensure that the 50-day moving average is below the current price and that the Awesome oscillator is in the positive zone.
  • Scenario No. 2: Buying Bitcoin can also be considered from the lower boundary at $62,900, provided there is no market reaction to its breakout in the opposite direction towards levels $63,400 and $64,100.

Sell Scenario

  • Scenario No. 1: I plan to sell Bitcoin today upon reaching an entry point around $62,900, targeting a drop to the level of $62,200. At around $62,200, I will exit from sell positions and immediately buy on the bounce. Before selling on a breakout, ensure that the 50-day moving average is above the current price and that the Awesome oscillator is in the negative zone.
  • Scenario No. 2: I can also consider selling Bitcoin from the upper boundary at $63,400 if there is no market reaction to its breakout in the opposite direction towards levels $62,900 and $62,200.

Ethereum

Exchange Rates 07.07.2026 analysis

Buy Scenario

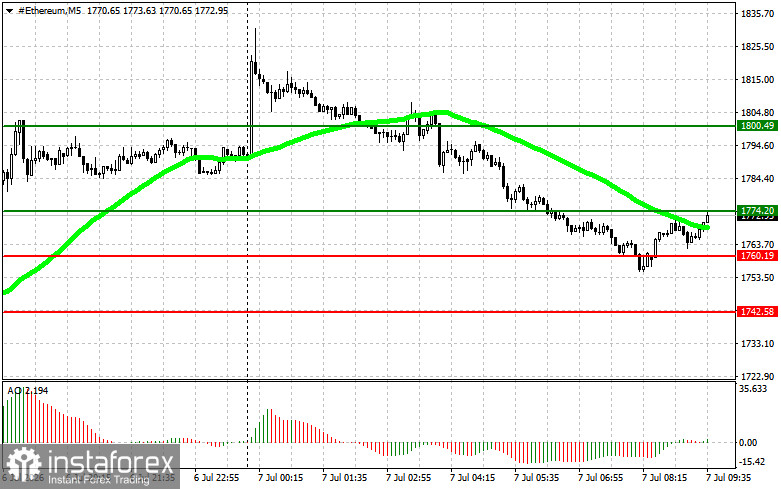
  • Scenario No. 1: I will buy Ethereum today upon reaching an entry point around $1,774, targeting a rise to the level of $1,800. At around $1,800, I will exit from buy positions and immediately sell on the bounce. Before buying on a breakout, ensure that the 50-day moving average is below the current price and that the Awesome oscillator is in the positive zone.
  • Scenario No. 2: Buying Ethereum can also be considered from the lower boundary at $1,760, provided there is no market reaction to its breakout in the opposite direction towards levels $1,774 and $1,800.

Sell Scenario

  • Scenario No. 1: I plan to sell Ethereum today upon reaching an entry point around $1,760, targeting a drop to the level of $1,742. At around $1,742, I will exit from sell positions and immediately buy on the bounce. Before selling on a breakout, ensure that the 50-day moving average is above the current price and that the Awesome oscillator is in the negative zone.
  • Scenario No. 2: I can also consider selling Ethereum from the upper boundary at $1,774 if there is no market reaction to its breakout in the opposite direction towards levels $1,760 and $1,742.

*تعینات کیا مراد ہے مارکیٹ کے تجزیات یہاں ارسال کیے جاتے ہیں جس کا مقصد آپ کی بیداری بڑھانا ہے، لیکن تجارت کرنے کے لئے ہدایات دینا نہیں.

Benefit from analysts’ recommendations right now
Top up trading account
Open trading account

InstaSpot analytical reviews will make you fully aware of market trends! Being an InstaSpot client, you are provided with a large number of free services for efficient trading.

Earn on cryptocurrency rate changes with InstaSpot
Download MetaTrader 4 and open your first trade
ابھی فوری بات نہیں کرسکتے ؟
اپنا سوال پوچھیں بذریعہ چیٹ.