




انسٹا فاریکس ٹیم میں لیجنڈ!
لیجنڈ!آپ کو لگتا ہے کہ یہ حیرت انگیز بیانات ہے؟ لیکن ہمیں ایسے شخص کو کیا کہنا چاہئے ، جو 18 سال میں جونیئر ورلڈ شطرنج چیمپئن شپ جیتنے والا پہلا ایشین بن گیا تھا اور 19 میں پہلا ہندوستانی گرینڈ ماسٹر بنا؟ ورلڈ چیمپیئن ٹائٹل کے لئے یہ مشکل آغاز تھا جو وشونااتھ آنند کے لئے تھا ، وہ شخص جو ہمیشہ کے لئے شطرنج کی تاریخ کا حصہ بن گیا تھا۔ انسٹا فاریکس ٹیم میں اب ایک اور لیجنڈ!





Borussia is one of the most titled football clubs in Germany, which has repeatedly proved to fans: the spirit of competition and leadership will certainly lead to success. Trade in the same way that sports professionals play the game: confidently and actively. Keep a "pass" from Borussia FC and be in the lead with InstaSpot!

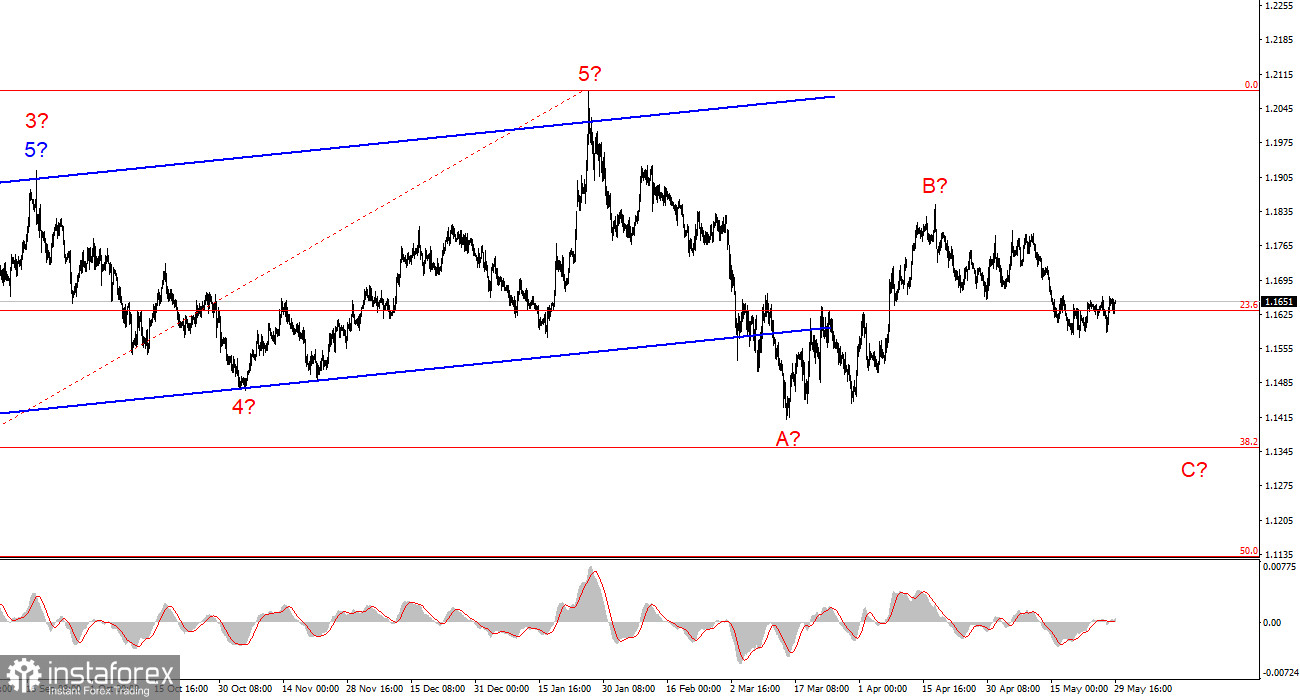
یورو / یو ایس ڈی کے 4 گھنٹے کے چارٹ پر ویوو کا پیٹرن کچھ بدل گیا ہے۔ پچھلے سال جنوری میں شروع ہونے والے اوپر کی طرف رجحان والے طبقہ (لوئر چارٹ) کی منسوخی کے بارے میں اب بھی بات کرنے کی کوئی وجہ نہیں ہے۔ تاہم، رجحان کی ساخت اب ایک اصلاحی شکل اختیار کر چکی ہے۔ ایک طویل مدتی نقطہ نظر سے، ایک ویوو سی کے تیار ہونے کی توقع کی جا سکتی ہے، اس کی کم پوزیشن ویوو اے سے نیچے ہے۔
فی الوقت، یورو کی اتنی نمایاں کمی پر یقین کرنا مشکل ہے، لیکن 2026 کی پہلی سہ ماہی نے ثابت کیا کہ جغرافیائی سیاست مارکیٹ میں ڈرامائی تبدیلیاں پیدا کر سکتی ہے اور قائم شدہ رجحانات کو ریورس کر سکتی ہے۔
نچلے ٹائم فریم پر، میں ایک کلاسک تھری ویو اصلاحی اوپر کی طرف ڈھانچے کی شناخت کر سکتا ہوں۔ اس کی تکمیل کے بعد، ایک نیا نیچے کی طرف رجحان والا طبقہ تیار ہونا شروع ہوا، جسے منطقی طور پر ایک متاثر کن ساخت کی شکل اختیار کرنی چاہیے۔ اگر یہ مفروضہ درست ہے، تو ہمیں 1.1400 کی سطح سے نیچے کے اہداف کے ساتھ، اعلی ڈگری کی ویوو سی کے اندر پانچ ویوووں کے ڈھانچے کی تشکیل کی توقع کرنی چاہیے۔
کیا امریکی ڈالر کی اتنی مضبوطی کی توقع کرنے کی بنیادی وجوہات ہیں؟ میرے خیال میں اس مرحلے پر نہیں۔ گزشتہ ہفتے نے ظاہر کیا کہ تہران اور واشنگٹن مذاکرات جاری رکھے ہوئے ہیں، جو نظریاتی طور پر ایک کامیاب نتیجہ کی طرف لے جا سکتے ہیں۔ جب تک کسی معاہدے کا امکان باقی رہے گا، ڈالر کا مضبوط ہونا جاری رکھنا مشکل ہو گا۔
یورو / یو ایس ڈی جوڑا جمعہ بھر میں غیر تبدیل ہوا، جبکہ اتار چڑھاؤ ایک بار پھر محدود رہا۔ جمعرات ایک بہت زیادہ فعال تجارتی دن تھا، لیکن اس میں اہم واقعات کی ایک بڑی تعداد بھی شامل تھی۔
آج، صرف جرمنی کی افراط زر اور بے روزگاری کی رپورٹیں توجہ کے مستحق ہیں، حالانکہ مارکیٹ نے بڑی حد تک دونوں ریلیز کو نظر انداز کیا ہے۔ بہر حال، میں کنزیومر پرائس انڈیکس پر توجہ مرکوز کرنا چاہوں گا، کیونکہ یہ یورو کے لیے خاص طور پر مثبت مضمرات فراہم نہیں کرتا ہے۔
مئی کے لیے ابتدائی افراط زر 2.6 فیصد پر آیا، جو کہ سالانہ بنیادوں پر اپریل کے مقابلے میں 0.3 فیصد پوائنٹ کم تھا اور مارکیٹ کی توقعات سے بھی 0.3 فیصد کم تھا۔ 2.6% کے اعداد و شمار سے پتہ چلتا ہے کہ افراط زر محض سست نہیں ہو رہا ہے - یہ ای سی بی کے ہدف کی سطح کی طرف آہستہ آہستہ بڑھ رہا ہے۔
بلاشبہ، یہ مئی کے آخری پڑھنے کے بجائے صرف ایک ابتدائی تخمینہ ہے۔ مزید برآں، یہ صرف ایک یوروزون ملک کے ڈیٹا کی عکاسی کرتا ہے۔ تاہم، جرمنی بلاک میں سب سے بڑی معیشت رکھتا ہے، جس کی وجہ سے اس کے اقتصادی اشارے خاصے اہم ہیں۔
اگر جرمنی میں افراط زر کی رفتار کم ہو رہی ہے، تو یہ یورو زون میں بھی سست ہو سکتی ہے۔ اگر یورو زون میں افراط زر میں کمی واقع ہو رہی ہے، تو ای سی بی کو جون میں مانیٹری پالیسی سخت کرنے کے لیے آگے بڑھنے کی کم عجلت ہو سکتی ہے۔
یہ یاد کرنے کے قابل ہے کہ صرف کل مارکیٹ کے شرکاء نے توقع کی تھی کہ ای سی بی واحد اہم مرکزی بینک ہوگا جو اگلے ماہ پالیسی کو سخت کرنے کا امکان ہے۔ یونائیٹڈ کنگڈم میں، اپریل میں افراط زر کی شرح میں کمی آئی، جبکہ فیڈرل ریزرو کے پاس فی الحال شرح سود میں اضافے کی بہت کم گنجائش ہے اور وہ انتظار اور دیکھو کے طریقہ کار کو برقرار رکھے ہوئے ہے۔
نتیجے کے طور پر، مارکیٹ یورو زون میں سخت پالیسی کے لیے پوزیشن میں تھی۔ تاہم، اس منظر نامے کے امکان میں اب نمایاں کمی آئی ہے، جو یورو پر اضافی دباؤ پیدا کر سکتا ہے۔
عمومی نتائج
میرے یورو / یو ایس ڈی تجزیہ کی بنیاد پر، میں اس نتیجے پر پہنچتا ہوں کہ آلہ اوپر کی طرف رجحان والے حصے (نچلے چارٹ) کے اندر رہتا ہے، جبکہ مختصر مدت میں یہ اصلاحی ڈھانچے کے اندر رہتا ہے۔
اصلاحی اے - بی - سی ویوو کا نمونہ مکمل دکھائی دیتا ہے۔ لہٰذا، ویوو 3 یا ویوو سی ترقی کرتی رہتی ہے اور یہ ایک بڑی ویوو سی ساخت کا حصہ بن سکتی ہے۔ پوری ویوو سی (اگر موجودہ ویوو کی گنتی درست ہے) بالآخر 1.1400 کی سطح سے نیچے تک پھیل سکتی ہے۔
تاہم، اس طرح کے منظر نامے کو مضبوط جغرافیائی سیاسی حمایت کی ضرورت ہوگی۔ بصورت دیگر، موجودہ نیچے کی طرف ویوو کی ترتیب اے بی سی اصلاح کی شکل اختیار کر سکتی ہے اور 1.1578 کی سطح کے قریب ختم ہو سکتی ہے۔
اعلی ٹائم فریم پر، اوپر کی طرف رجحان والا طبقہ نظر آتا ہے، جس کے بعد اصلاحی ویوو کے ڈھانچے کی ترقی ہوتی ہے۔ قریب کی مدت میں، ویوو سی کے 1.1352 کے قریب اہداف کے ساتھ بننے کی توقع ہے، جو کہ 38.2% فیبوناچی ریٹریسمنٹ لیول کے مساوی ہے۔
اے- بی-سی ڈھانچہ مکمل ہونے کے بعد، ایک نیا طویل مدتی اوپر کی طرف رجحان تیار ہونا شروع ہو سکتا ہے۔
میرے تجزیہ کے بنیادی اصول
ویوو کے ڈھانچے سادہ اور آسان تشریح ہونے چاہئیں۔ پیچیدہ ڈھانچے کی تجارت کرنا مشکل ہے اور اکثر ان پر نظر ثانی کی جاتی ہے۔
اگر مارکیٹ کیا کر رہی ہے اس پر اعتماد نہیں ہے، تو بہتر ہے کہ بازار سے دور رہیں۔
مارکیٹ کی سمت کے بارے میں قطعی یقین ناممکن ہے۔ ہمیشہ حفاظتی اسٹاپ لاس آرڈرز استعمال کریں۔
ویوو تجزیہ کو تجزیہ اور تجارتی حکمت عملی کی دوسری شکلوں کے ساتھ ملایا جا سکتا ہے۔
*تعینات کیا مراد ہے مارکیٹ کے تجزیات یہاں ارسال کیے جاتے ہیں جس کا مقصد آپ کی بیداری بڑھانا ہے، لیکن تجارت کرنے کے لئے ہدایات دینا نہیں.
InstaSpot analytical reviews will make you fully aware of market trends! Being an InstaSpot client, you are provided with a large number of free services for efficient trading.


