


ہمارے ٹیم میں 7000000 سے ذائد تاجران شامل ہیں
ہم تجارت کی بہتری کے لئے ہر روز اکھٹے کام کرتے ہیں اور بہترین نتائج حاصل کرتے ہوئے آگے کی جانب بڑھتے ہیں
دُنیا بھر سے سے لاکھوں ہمارے بہترین کام کو سند عطاء کرتے ہیں آپ اپنا انتحاب کریں باقی ہم آپ کی توقعات پر پورا اترنے کے لئے اپنی بہترین کوشش کریں گے
ہم مل کر ایک بہترین ٹیم بناتے ہیں
انسٹا فاریکس آپ سے کام کرتے ہوئے فخر محسوس کرتا ہے


ایکٹر - یو سی ایف 6 ٹورنامنٹ چیمپین اور واقعی ہیرو
ایک فرد کے جس نے اپنا آپ منوایا ہے وہ فرد کہ جو ہماری راہ پر چلا ہے.
ٹکٹا روو کی کامیابی کا راز یہ ہے کہ وہ اپنے اہداف کی جانب مسلسل بڑھتا رہتا ہے
اپنے ہنر یا ٹیلنٹ کے تمام پہلو آشکار کررہے ہیں
پہچانیں ، کوشش کریں ، ناکام ہوں لیکن کبھی نہ رُکیں
انسٹا فاریکس آپ کی کامیابی کی کہاں یہاں سے شروع ہوتی ہے

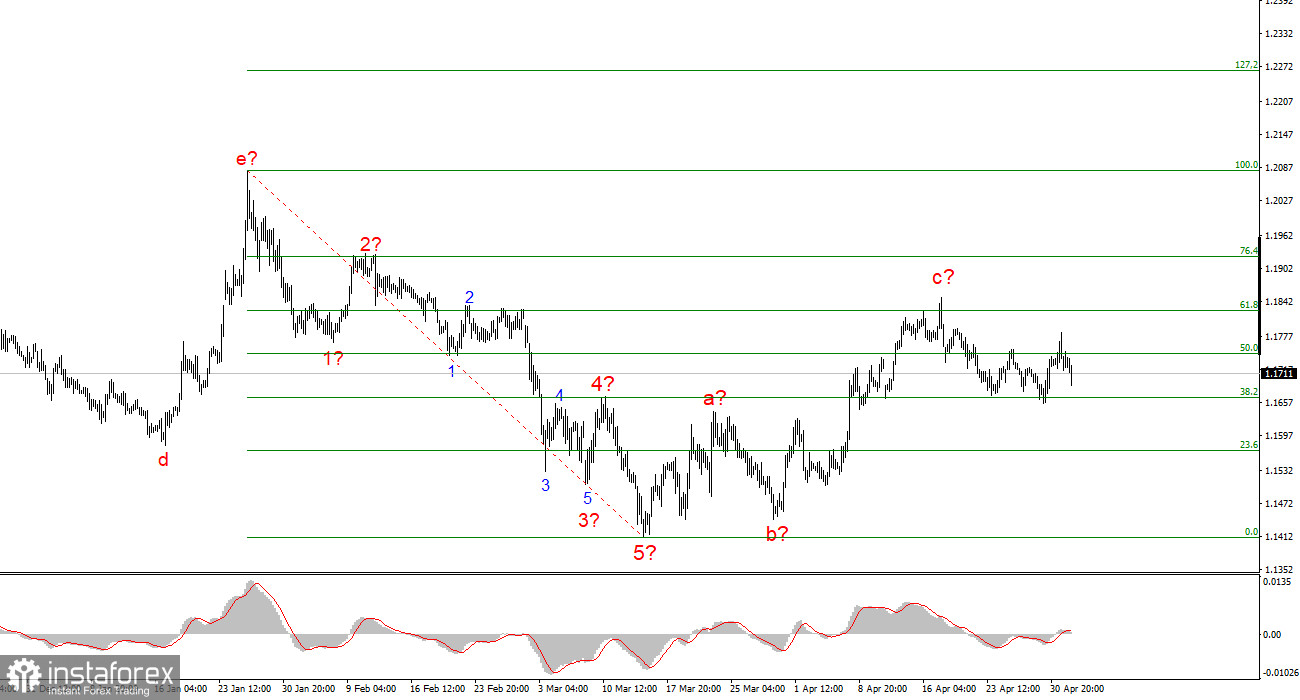
The wave pattern on the 4-hour chart for EUR/USD has changed. There is still no talk of canceling the upward trend segment (shown in the lower chart), which began in January last year; however, the wave structure of the trend now looks quite ambiguous. In such situations, I always recommend switching to a lower timeframe (upper chart) and analyzing the simplest and smallest wave structures in order to make a short-term forecast, which is sufficient for opening trades. Wave structures can be very complex and allow for multiple scenarios. The easiest approach is to trade based on standard "five-three" patterns.
In the chart above, I can identify a classic five-wave impulse structure with an extended third wave. After the completion of this structure, a corrective formation of at least three waves began. We have already seen three waves, so in the near future the market will likely form at least one more downward corrective wave. How events develop further depends on geopolitics: whether the upward structure becomes more complex or a new downward trend segment begins.
The EUR/USD rate declined by 10 basis points on Monday, despite fairly strong intraday volatility. However, overall market activity—even on Monday, even with geopolitical news—remains relatively low. In general, I would not say that weak movements are necessarily a bad thing; on the contrary, they may even be easier to work with. At present, the instrument continues to form a downward wave, and everything suggests that we may see a complication of the upward structure. This conclusion is based on several factors.
First, important U.S. labor market and unemployment data will be released this week, and such data always poses increased risk for the dollar. Second, last week ended with another diplomatic failure by Tehran, and the new week began with renewed tensions in the Strait of Hormuz, including an attack on a U.S. destroyer. According to some reports, the damage was not significant, but Washington may now respond with a strike against Iran, which would nullify the already limited diplomatic efforts of recent weeks. However, despite all these negative developments, demand for the U.S. dollar declined only slightly. Last week, a failed attempt to break below the 1.1665 level led to a rebound from the lows, and so far the market has not attempted to move below it again. Therefore, I assume that the downward wave formation may be complete, and we could see a new upward movement targeting levels above the peak of wave C—closer to the 1.19 level. A key condition for this scenario is the absence of further escalation in the Middle East.
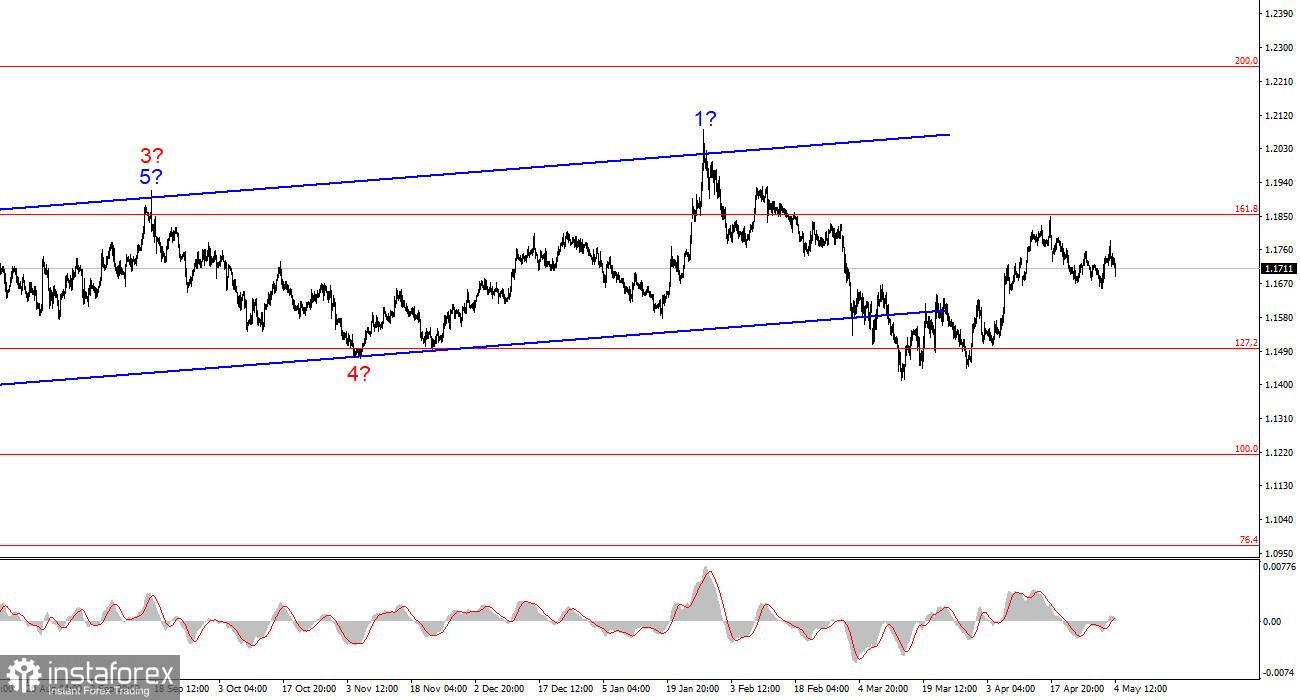
Based on the analysis of EUR/USD, I conclude that the instrument remains within an upward trend segment (lower chart), while in the short term it is within a corrective structure. The corrective wave formation appears complete and could only become more complex and extended if the geopolitical situation in the Middle East does not deteriorate this week. Otherwise, a new downward trend segment may begin from current levels. Since we have already seen a corrective wave, I expect a new upward move from current levels with targets around the 1.19 level.
On a smaller timeframe, the entire upward trend segment is visible. The wave structure is not entirely standard, as corrective waves vary in size. For example, the higher-degree wave 2 is smaller than the internal wave 2 within wave 3. However, such cases do occur. I would like to emphasize that it is better to identify clear structures on charts rather than strictly adhere to labeling every wave. Recent waves are difficult to identify, which is why I rely more on the higher timeframe in my analysis.
Key Principles of My Analysis:
*تعینات کیا مراد ہے مارکیٹ کے تجزیات یہاں ارسال کیے جاتے ہیں جس کا مقصد آپ کی بیداری بڑھانا ہے، لیکن تجارت کرنے کے لئے ہدایات دینا نہیں.
InstaSpot analytical reviews will make you fully aware of market trends! Being an InstaSpot client, you are provided with a large number of free services for efficient trading.


