


ہمارے ٹیم میں 7000000 سے ذائد تاجران شامل ہیں
ہم تجارت کی بہتری کے لئے ہر روز اکھٹے کام کرتے ہیں اور بہترین نتائج حاصل کرتے ہوئے آگے کی جانب بڑھتے ہیں
دُنیا بھر سے سے لاکھوں ہمارے بہترین کام کو سند عطاء کرتے ہیں آپ اپنا انتحاب کریں باقی ہم آپ کی توقعات پر پورا اترنے کے لئے اپنی بہترین کوشش کریں گے
ہم مل کر ایک بہترین ٹیم بناتے ہیں
انسٹا فاریکس آپ سے کام کرتے ہوئے فخر محسوس کرتا ہے


ایکٹر - یو سی ایف 6 ٹورنامنٹ چیمپین اور واقعی ہیرو
ایک فرد کے جس نے اپنا آپ منوایا ہے وہ فرد کہ جو ہماری راہ پر چلا ہے.
ٹکٹا روو کی کامیابی کا راز یہ ہے کہ وہ اپنے اہداف کی جانب مسلسل بڑھتا رہتا ہے
اپنے ہنر یا ٹیلنٹ کے تمام پہلو آشکار کررہے ہیں
پہچانیں ، کوشش کریں ، ناکام ہوں لیکن کبھی نہ رُکیں
انسٹا فاریکس آپ کی کامیابی کی کہاں یہاں سے شروع ہوتی ہے

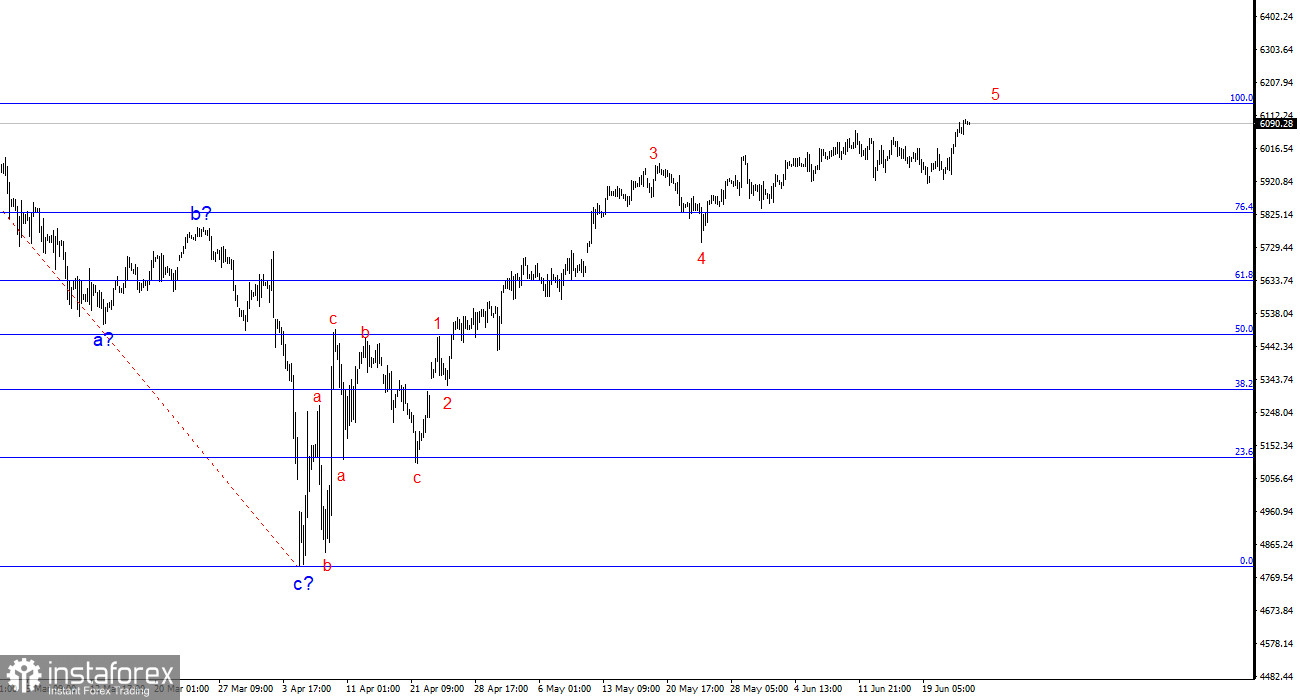
The wave pattern on the 24-hour chart for the #SPX instrument appears generally clear. At this point, the formation of an upward trend segment is presumably complete. In my view, we are likely to see a prolonged continuation of the corrective wave series, as the current correction phase looks rather unconvincing — it consists of only a single wave. I would prefer to see a more clearly defined three- or five-wave structure.
On the 4-hour chart, we see a completed three-wave downward structure, followed by a strong rally. While this rally is certainly part of an upward trend, I wouldn't classify it as impulsive despite its strength. The first wave formed as a three-wave structure (a-b-c), and so did the second wave. Therefore, I believe we are witnessing an extended series of corrective structures. I do not think the S&P 500's decline is over.
The #SPX instrument have fully recovered from the crash in the first quarter. But now the key question is: what to expect next? The S&P 500 is once again trading near its all-time highs, yet I see neither a solid foundation for the rally of recent months nor compelling reasons for it to continue. Investors have ignored the military conflict between Iran and Israel — which later involved the U.S. — and have been turning a blind eye to the global trade war for two months. Judging by the recent rise in the S&P 500, one might think everything is fine in the U.S., the economy is growing, and there are no problems at all. But in reality, that is not the case.
In my view, we are dealing with artificial growth. Let me remind you that Robert Kiyosaki predicted a total collapse of the economy, fiat money, and the stock market this summer. While I don't expect such a catastrophe, I do believe the stock market is overheated again and has recovered for unclear reasons. Therefore, I still do not believe that the decline in the S&P 500 and other major indices is over.
On the daily time frame, the previous correction phase had a five-wave structure. The current corrective structure is made up of just one wave. The index is rising, while the MACD indicator is falling. A failed attempt to break above the 6100 level — which corresponds to the 200.0% Fibonacci extension — would indicate the market's readiness for another, potentially sharp, decline.
I also disagree with many analysts who argue that stock indices are rising due to expectations of monetary policy easing by the Fed. In my opinion, this factor no longer has any real influence on the market in 2025. A clear example is the U.S. dollar, which continues to weaken despite rate cuts by the ECB and BoE. It's also worth noting that last year the market expected 6–7 rounds of rate cuts, and in 2025 — 4. Yet the Fed has kept rates unchanged at every meeting, and now only plans 4 rounds of easing through 2027, down from the previously forecasted 6.
Based on the analysis of #SPX, I conclude that the upward trend segment has been completed. Trump continues to pursue policies that threaten the stability of the U.S. economy and American companies (trade wars, tariffs, export restrictions). We saw a strong wave of stock buying at attractive prices, but new reasons are needed to justify another leg up. Therefore, I believe the corrective phase of the trend is not yet over, and I am preparing for another decline in the index with targets near the 4800 mark and possibly lower.
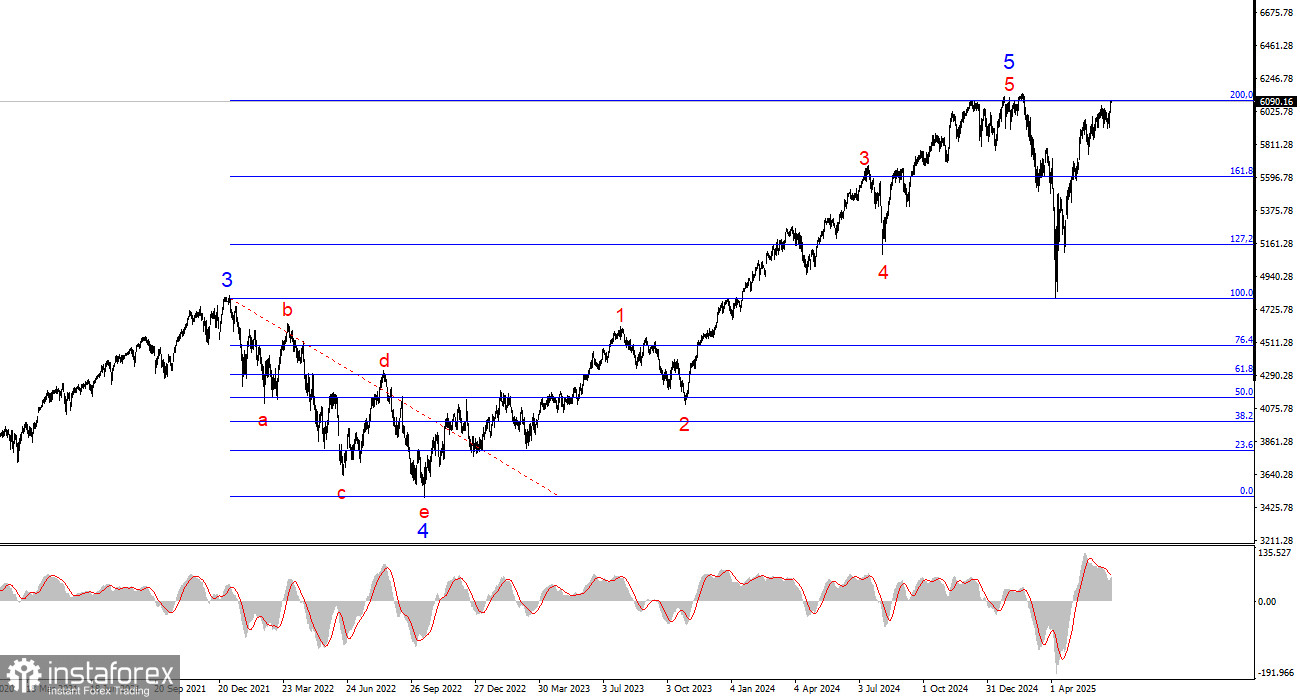
On the higher time frame, the wave pattern is fairly straightforward: a clear five-wave structure with a five-wave formation inside the fifth wave. The bullish trend segment is complete. Accordingly, I would prepare for a new downward phase of the trend, despite the recent strong rally in the index.
Core Principles of My Analysis
*تعینات کیا مراد ہے مارکیٹ کے تجزیات یہاں ارسال کیے جاتے ہیں جس کا مقصد آپ کی بیداری بڑھانا ہے، لیکن تجارت کرنے کے لئے ہدایات دینا نہیں.
InstaSpot analytical reviews will make you fully aware of market trends! Being an InstaSpot client, you are provided with a large number of free services for efficient trading.


