


ہمارے ٹیم میں 7000000 سے ذائد تاجران شامل ہیں
ہم تجارت کی بہتری کے لئے ہر روز اکھٹے کام کرتے ہیں اور بہترین نتائج حاصل کرتے ہوئے آگے کی جانب بڑھتے ہیں
دُنیا بھر سے سے لاکھوں ہمارے بہترین کام کو سند عطاء کرتے ہیں آپ اپنا انتحاب کریں باقی ہم آپ کی توقعات پر پورا اترنے کے لئے اپنی بہترین کوشش کریں گے
ہم مل کر ایک بہترین ٹیم بناتے ہیں
انسٹا فاریکس آپ سے کام کرتے ہوئے فخر محسوس کرتا ہے


ایکٹر - یو سی ایف 6 ٹورنامنٹ چیمپین اور واقعی ہیرو
ایک فرد کے جس نے اپنا آپ منوایا ہے وہ فرد کہ جو ہماری راہ پر چلا ہے.
ٹکٹا روو کی کامیابی کا راز یہ ہے کہ وہ اپنے اہداف کی جانب مسلسل بڑھتا رہتا ہے
اپنے ہنر یا ٹیلنٹ کے تمام پہلو آشکار کررہے ہیں
پہچانیں ، کوشش کریں ، ناکام ہوں لیکن کبھی نہ رُکیں
انسٹا فاریکس آپ کی کامیابی کی کہاں یہاں سے شروع ہوتی ہے

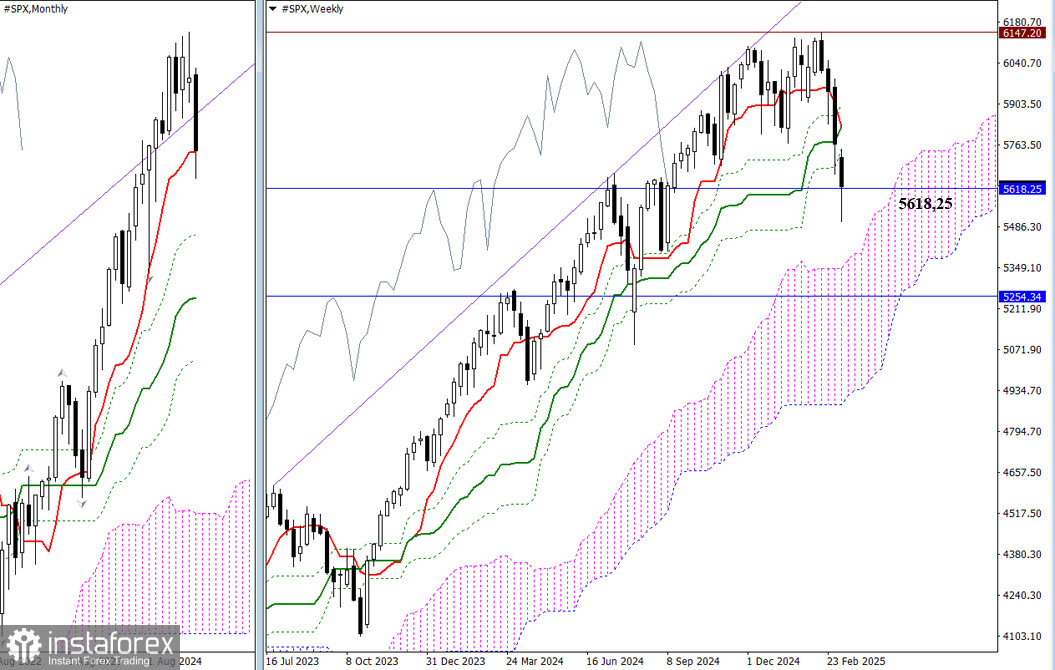
Last week, the bears continued to decline but failed to close below the tested support level of the monthly short-term trend at 5618.25, only leaving a long lower shadow beyond it. A break below this level would lead to a retest of the weekly Ichimoku cross, which ranges from 5749.63, 5825.54 to 5901.45. If a breakdown occurs, it would signify the continuation of the monthly downward correction towards the next support level at 5254.34, which is now reinforced by the weekly Ichimoku cloud, ranging from 5396.85 to 4936.71.
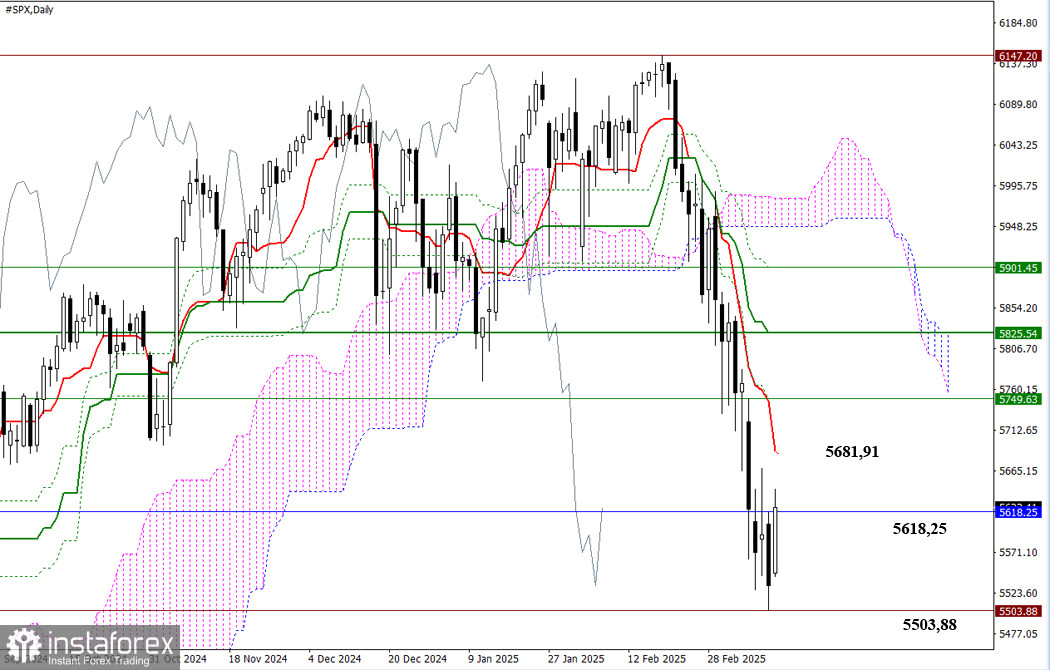
In the daily timeframe, it is evident that after initially dropping below the monthly support level of 5618.25 at the beginning of the week, the SPX has been attempting to recover and consolidate above this lost level for the remainder of the week. If the bulls continue to regain their positions, a full upward correction towards the daily short-term trend at 5681.91 will first need to take place. Conversely, if bearish activity returns to the market, the bears must update the minimum extremum at 5503.88 to unveil new prospects.
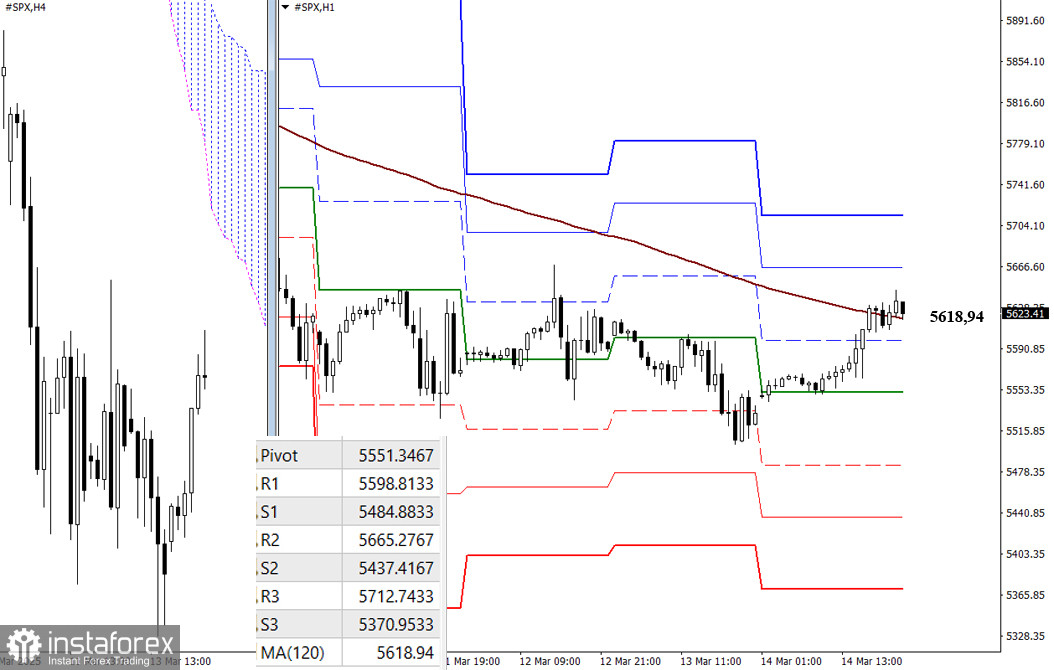
The current weekly long-term trend is at 5618.94 and is being tested on the lower timeframes. Holding above this level provides a significant advantage. If the trend breaks and moves upward, it could strengthen bullish sentiment. Conversely, if there is a retracement and the price moves below the trend, it may indicate a continuation of the downward movement.
Additionally, the supports and resistances indicated by the classic Pivot levels serve as important reference points throughout the day. These levels are updated daily, and new relevant data will become available when the market opens.
***
*تعینات کیا مراد ہے مارکیٹ کے تجزیات یہاں ارسال کیے جاتے ہیں جس کا مقصد آپ کی بیداری بڑھانا ہے، لیکن تجارت کرنے کے لئے ہدایات دینا نہیں.
InstaSpot analytical reviews will make you fully aware of market trends! Being an InstaSpot client, you are provided with a large number of free services for efficient trading.


