


Nossa equipe tem mais de 7,000,000 traders!
Todos os dias, trabalhamos juntos para melhorar a negociação. Obtivemos resultados elevados e avançamos.
O reconhecimento de milhões de traders em todo o mundo é a melhor apreciação do nosso trabalho! Você nos escolheu e faremos tudo o que for necessário para atender às suas expectativas!
Nós somos uma ótima equipe juntos!
InstaSpot. Orgulho de trabalhar para você!


Ator, hexacampeão do UFC e um verdadeiro herói!
Um homem de sucesso. Um homem que mostra o nosso caminho.
O segredo por trás do sucesso de Taktarov é um movimento constante em direção ao objetivo.
Revele todos os lados do seu talento!
Descubra, tente, falhe, mas nunca pare!
I InstaSpot. Sua história de sucesso começa aqui!
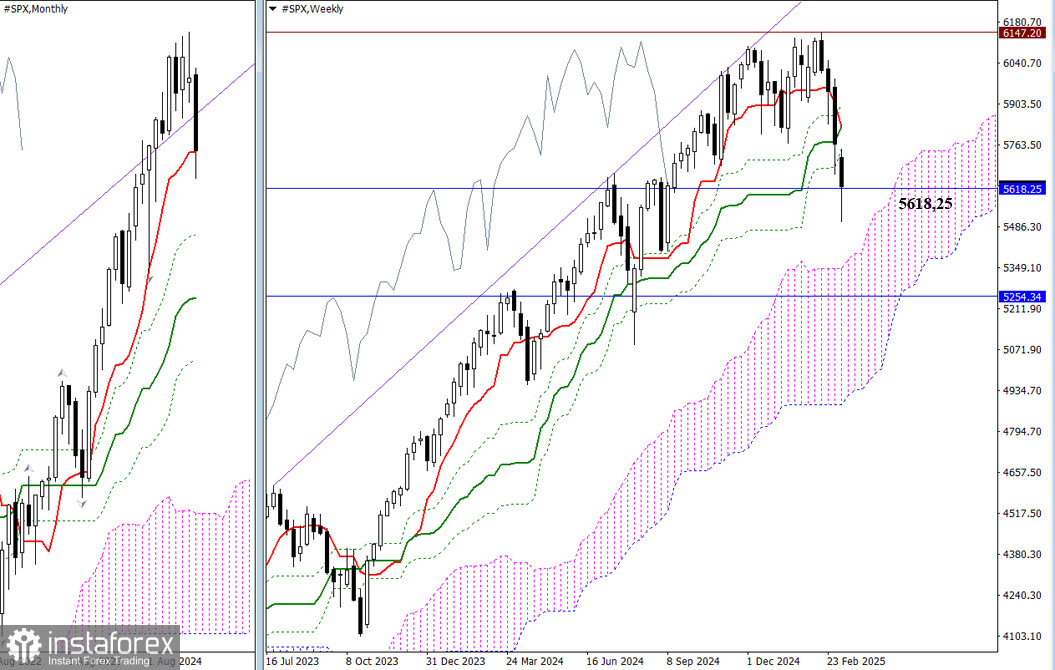
Last week, the bears continued to decline but failed to close below the tested support level of the monthly short-term trend at 5618.25, only leaving a long lower shadow beyond it. A break below this level would lead to a retest of the weekly Ichimoku cross, which ranges from 5749.63, 5825.54 to 5901.45. If a breakdown occurs, it would signify the continuation of the monthly downward correction towards the next support level at 5254.34, which is now reinforced by the weekly Ichimoku cloud, ranging from 5396.85 to 4936.71.
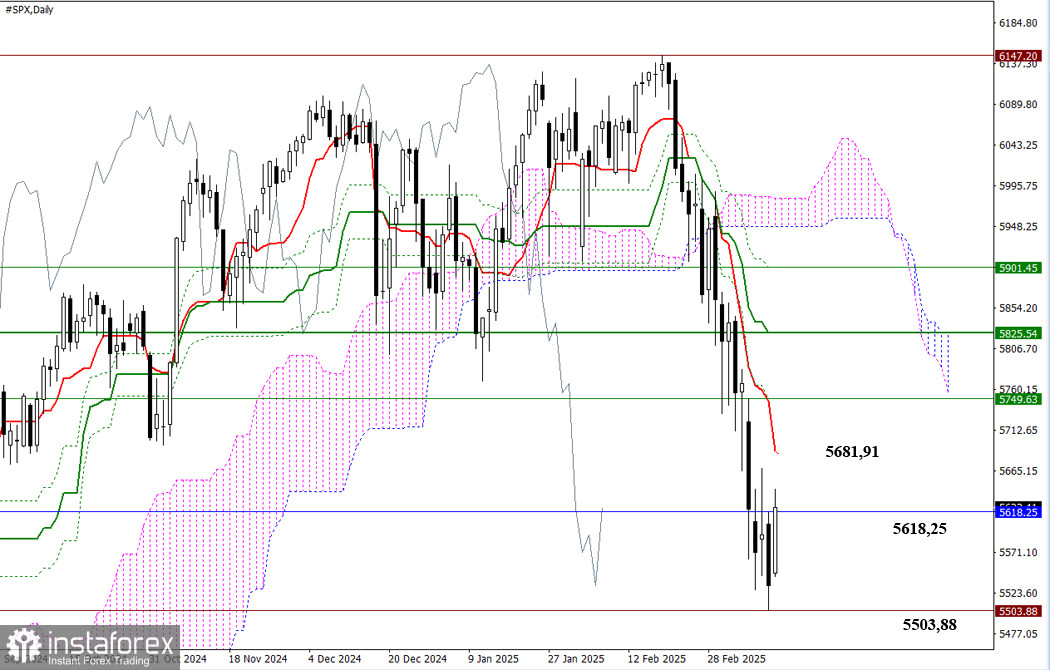
In the daily timeframe, it is evident that after initially dropping below the monthly support level of 5618.25 at the beginning of the week, the SPX has been attempting to recover and consolidate above this lost level for the remainder of the week. If the bulls continue to regain their positions, a full upward correction towards the daily short-term trend at 5681.91 will first need to take place. Conversely, if bearish activity returns to the market, the bears must update the minimum extremum at 5503.88 to unveil new prospects.
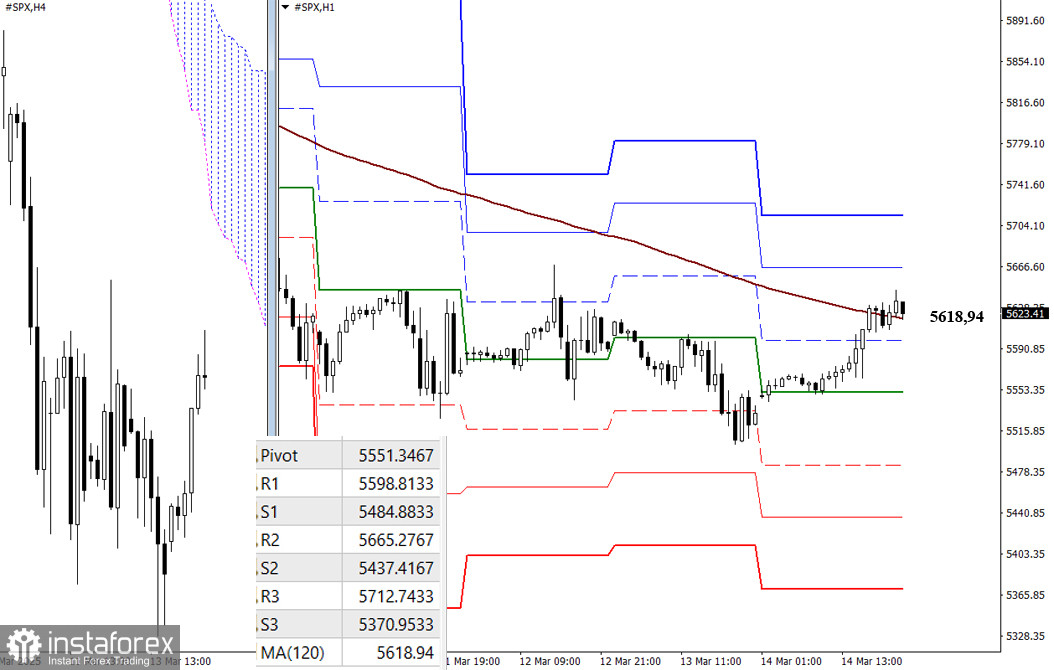
The current weekly long-term trend is at 5618.94 and is being tested on the lower timeframes. Holding above this level provides a significant advantage. If the trend breaks and moves upward, it could strengthen bullish sentiment. Conversely, if there is a retracement and the price moves below the trend, it may indicate a continuation of the downward movement.
Additionally, the supports and resistances indicated by the classic Pivot levels serve as important reference points throughout the day. These levels are updated daily, and new relevant data will become available when the market opens.
***
*A análise de mercado aqui postada destina-se a aumentar o seu conhecimento, mas não dar instruções para fazer uma negociação.
InstaSpot analytical reviews will make you fully aware of market trends! Being an InstaSpot client, you are provided with a large number of free services for efficient trading.


