


ہمارے ٹیم میں 7000000 سے ذائد تاجران شامل ہیں
ہم تجارت کی بہتری کے لئے ہر روز اکھٹے کام کرتے ہیں اور بہترین نتائج حاصل کرتے ہوئے آگے کی جانب بڑھتے ہیں
دُنیا بھر سے سے لاکھوں ہمارے بہترین کام کو سند عطاء کرتے ہیں آپ اپنا انتحاب کریں باقی ہم آپ کی توقعات پر پورا اترنے کے لئے اپنی بہترین کوشش کریں گے
ہم مل کر ایک بہترین ٹیم بناتے ہیں
انسٹا فاریکس آپ سے کام کرتے ہوئے فخر محسوس کرتا ہے


ایکٹر - یو سی ایف 6 ٹورنامنٹ چیمپین اور واقعی ہیرو
ایک فرد کے جس نے اپنا آپ منوایا ہے وہ فرد کہ جو ہماری راہ پر چلا ہے.
ٹکٹا روو کی کامیابی کا راز یہ ہے کہ وہ اپنے اہداف کی جانب مسلسل بڑھتا رہتا ہے
اپنے ہنر یا ٹیلنٹ کے تمام پہلو آشکار کررہے ہیں
پہچانیں ، کوشش کریں ، ناکام ہوں لیکن کبھی نہ رُکیں
انسٹا فاریکس آپ کی کامیابی کی کہاں یہاں سے شروع ہوتی ہے

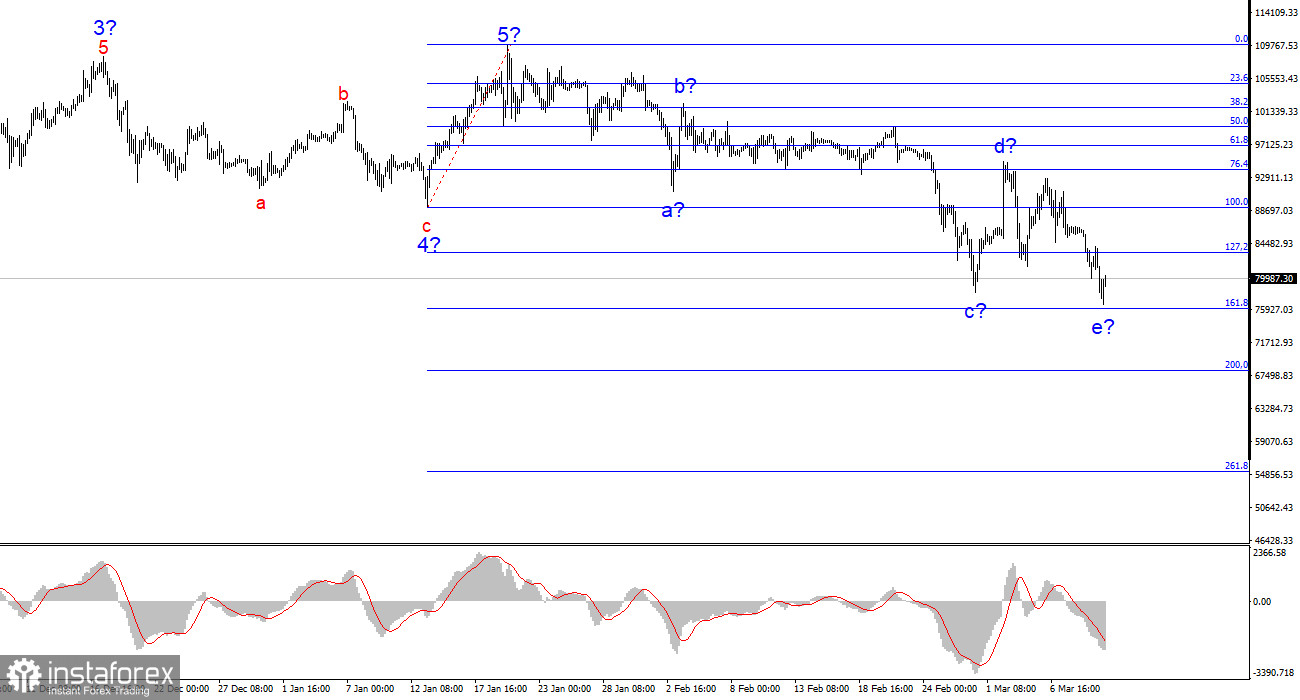
The wave structure on the 4-hour BTC/USD chart is quite clear. Following the completion of a five-wave bullish trend, the market has entered a downward phase, which currently appears to be a corrective wave. Based on this, I did not and do not expect Bitcoin to rise above $110,000 – $115,000 in the coming months.
The news cycle previously supported Bitcoin's growth, fueled by continuous institutional investments, participation from government entities and pension funds. However, Trump's policies have driven investors out of the market, and a trend cannot remain bullish indefinitely. The wave that began on January 20 does not resemble an impulse wave, indicating a complex corrective structure that could last for months. The internal structure of this first wave is complicated and ambiguous. It is crucial to remember that wave analysis should be as simple and clear as possible for effective trading.
Over the past five days, BTC/USD has fallen by $12,000. While this may seem significant, a $2,500 daily drop is not particularly extreme for Bitcoin. However, Bitcoin has been declining for two months, coinciding remarkably with Donald Trump's return to power in the U.S. While it is unrealistic to expect Bitcoin to keep falling for the next four years, market participants lack optimism regarding the "global cryptocurrency capital" narrative.
Trump may talk about creating a National Cryptocurrency Reserve, loosening regulations, and supporting the crypto sector, but the market needs concrete actions and real improvements. Moreover, even if these positive changes occur, the trend cannot always be bullish.
Currently, the latest downward wave has taken a five-wave structure, suggesting that it may be near completion, or could end around the $76,000 level, which corresponds to 161.8% Fibonacci retracement. If this assumption holds true, a new set of bullish waves (or a single corrective wave) could begin from current levels. I assume that the price action from January 20 until now represents a global "A" wave of a larger trend segment. This means that Bitcoin's decline is not over yet, but it may pause before resuming later.
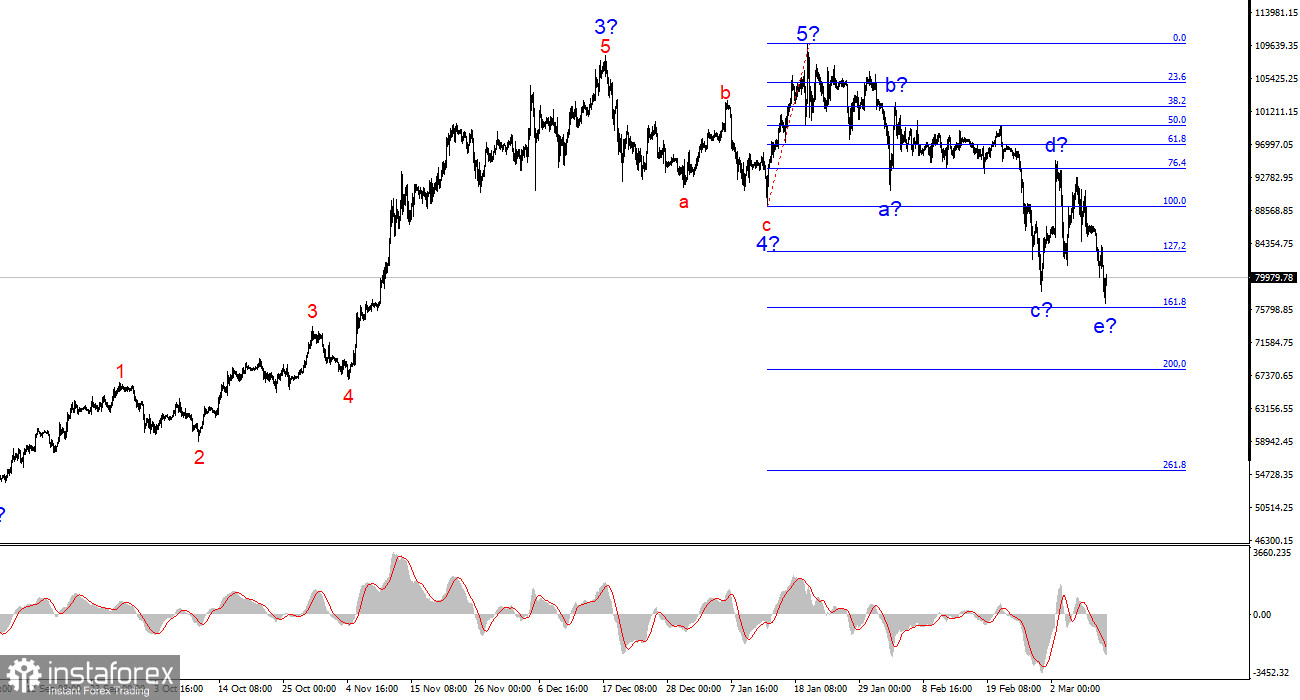
Based on my BTC/USD analysis, I conclude that the current bullish phase has ended. The market is now entering a complex, multi-month correction. I have previously advised against buying Bitcoin, and I continue to discourage long positions. A decline below the low of Wave 4 signals the formation of a broader downtrend, which is likely corrective in nature.
Thus, the best approach remains to look for selling opportunities. Bitcoin could fall to $76,000 (161.8% Fibonacci) and possibly $68,000 (200% Fibonacci) in the coming weeks. However, a short-term corrective rebound is also possible, providing new opportunities to short Bitcoin.
On higher timeframes, Bitcoin has completed a five-wave bullish cycle, and we are now witnessing the formation of either a corrective bearish phase or a fully-fledged downward trend.
Core Principles of My Analysis
*تعینات کیا مراد ہے مارکیٹ کے تجزیات یہاں ارسال کیے جاتے ہیں جس کا مقصد آپ کی بیداری بڑھانا ہے، لیکن تجارت کرنے کے لئے ہدایات دینا نہیں.
InstaSpot analytical reviews will make you fully aware of market trends! Being an InstaSpot client, you are provided with a large number of free services for efficient trading.


