


Ons team heeft meer dan 7,000,000 handelaren!
Elke dag werken we samen om de handel te verbeteren. We behalen hoge resultaten en gaan verder.
Erkenning door miljoenen handelaren over de hele wereld is de beste waardering voor ons werk! U heeft uw keuze gemaakt en wij zullen er alles aan doen om aan uw verwachtingen te voldoen!
Wij zijn samen een geweldig team!
InstaSpot. Trots om voor je te werken!


Acteur, UFC 6-toernooikampioen en een echte held!
De man die zichzelf heeft gemaakt. De man die onze kant op gaat.
Het geheim achter het succes van Taktarov is een constante beweging naar het doel.
Onthul alle kanten van je talent!
Ontdekken, proberen, falen - maar nooit stoppen!
InstaSpot. Je succesverhaal begint hier!

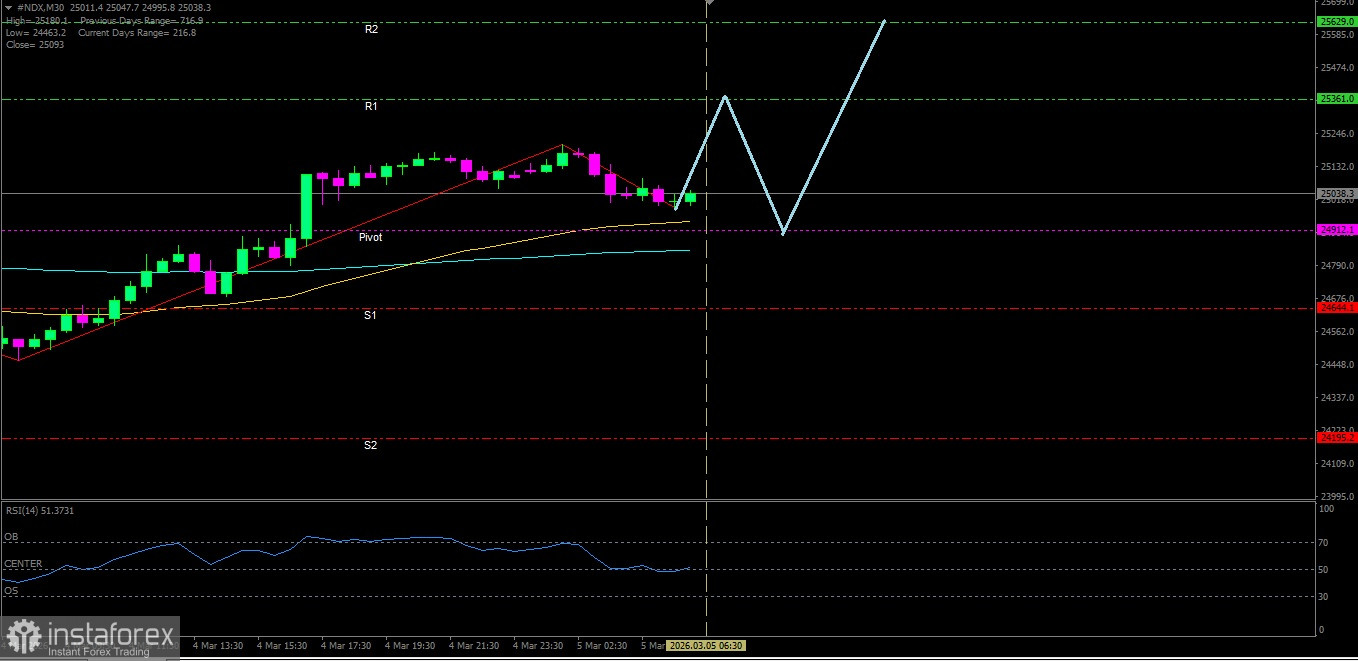
[#NDX]
Although RSI(14) indicator is in the Neutral-Bearish area, but with both EMAs forming a Golden Cross gives the confirmation that the Nasdaq 100 index still has the potential to continue its strengthening.
Key Levels
1. Resistance. 2 : 25629.0
2. Resistance. 1 : 25361.0
3. Pivot : 24912.1
4. Support. 1 : 24644.1
5. Support. 2 : 24195.2
Tactical Scenario
Positive Reaction Zone: If the price breaks out above 25361.0, there is a likelihood of a move up toward 25629.0.
Momentum Extension Bias: If 25629.0 is broken, the Nasdaq 100 could attempt to test 26077.9.
Invalidation Level / Bias Revision
The upside bias weakens if #NDX falls below 24195.2.
Technical Summary
EMA(50) : 24939.0
EMA(200): 24841.5
RSI(14) : 48.34
Economic News Release Agenda:
Tonight the United States will release the following economic data:
US - Challenger Job Cuts y/y - 19:30 WIB
US - Unemployment Claims - 20:30 WIB
US - Import Prices m/m - 20:30 WIB
US - Prelim Nonfarm Productivity q/q - 20:30 WIB
US - Prelim Unit Labor Costs q/q - 20:30 WIB
US - Natural Gas Storage - 22:30 WIB
*The market analysis posted here is meant to increase your awareness, but not to give instructions to make a trade.
InstaSpot analytical reviews will make you fully aware of market trends! Being an InstaSpot client, you are provided with a large number of free services for efficient trading.


