


Legenda dalam pasukan InstaSpot!
Legenda! Anda fikir ia adalah satu retorik yang besar? Tetapi bagaimana untuk kita memanggil seorang lelaki, yang telah menjadi pemain Asia pertama yang memenangi kejohanan catur dunia junior pada usia 18 tahun dan menjadi Grandmaster India pertama pada usia 19 tahun? Itulah permulaan yang sukar untuk merangkul gelaran Juara Dunia untuk Viswanathan Anand, seorang juara yang telah menjadi sebahagian daripada sejarah catur. Kini satu lagi legenda dalam pasukan InstaSpot!


Borussia adalah salah satu kelab bola sepak paling terkemuka di Jerman, yang telah berulang kali membuktikan kepada peminatnya: semangat persaingan dan kepemimpinan pasti akan membawa kepada kejayaan. Berdagang dengan cara yang sama seperti atlet sukan profesional beraksi menentang lawan: yakin dan aktif. Simpan "hantaran" dari Borussia FC dan menjadi pedagang hebat dengan InstaSpot!

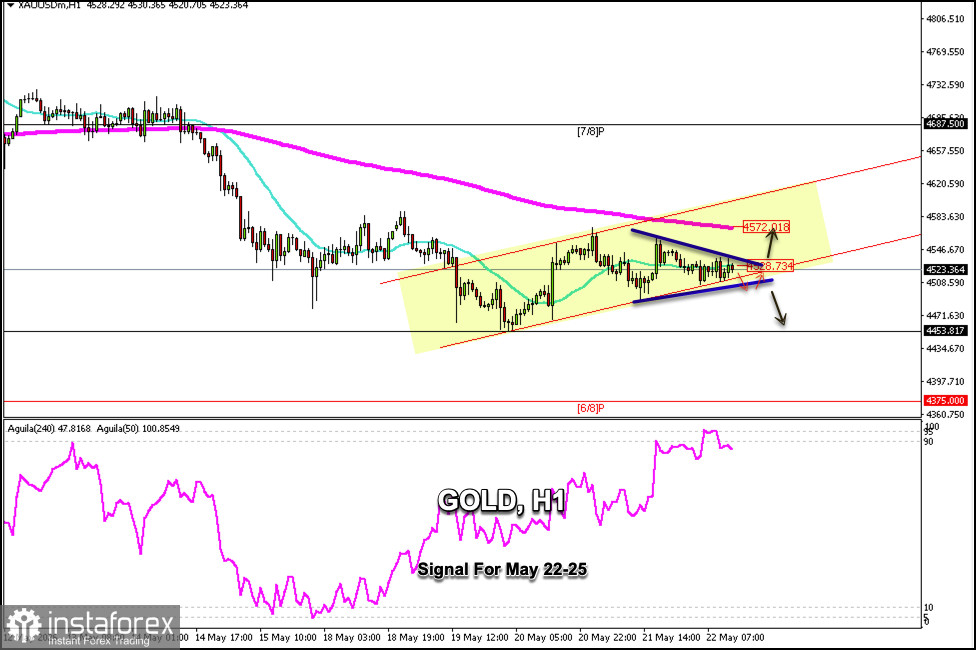
XAU/USD is trading around $4,523 within the ascending trend channel formed on the H1 chart. We could expect a technical bounce so that the price could reach the 200 EMA around $4,572.
According to the H1 chart, gold is overbought, so it may have difficulty rising above $4,530 in the coming hours, as the 21 SMA could exert downward pressure.
Gold is likely to return to $4,500 or even $4,580 if the downward pressure continues, potentially reaching the low of May 19th around $4,453.
We observe the formation of a symmetrical triangle pattern on the H1 chart. The instrument is expected to oscillate within this pattern in the coming hours, and we foresee consolidation within this area. Only a decisive break above $4,530 would be a bullish buy signal.
Conversely, a drop below $4,490 could lead to consolidation and a potential fall to $4,453.
* Analisis pasaran yang disiarkan di sini adalah bertujuan untuk meningkatkan kesedaran anda, tetapi tidak untuk memberi arahan untuk membuat perdagangan.
Kajian analisis InstaSpot akan membuat anda mengetahui sepenuhnya aliran pasaran! Sebagai pelanggan InstaSpot, anda disediakan sejumlah besar perkhidmatan percuma untuk dagangan yang cekap.


