


ตำนานแห่งทีม InstaSpot!
ที่สุด! คุณคิดว่าอะไรคือการทำให้รู้สึกฮึกเหิมกันละ? แต่พวกเราควรจะเรียกคนที่กลายมาเป็นชาวเอเชียคนแรกที่คว้าแชมป์หมากรุกระดับโลกรุ่นเยาวชนอายุ 18 ปี และยังกลายมาเป็นแกรนด์มาสเตอร์ชาวอินเดียคนแรกด้วยอายุ 19ปีเท่านั้น? นั้นเป็นจุดเริ่มต้นของเส้นทางสู่การเป็นแชมป์โลกสำหรับคุณ Viswanathan Anand คนที่กลายมาเป็นส่วนหนึ่งในหน้าประวติศาสตร์หมากรุกไปตลาดกาล ตอนนี้ก็มีอีกตำนานมาอยู่ในทีม InstaSpot แล้ว!


Borussia เป็นหนึ่งในสโมสรฟุตบอลขึ้นชื่อในประเทศเยอรมนี ที่ได้พิสูจน์ให้กับเหล่าแฟนๆเห็นแล้วถึงจิตวิญญาณของการแข่งขัน และการขึ้นมาสู่จุดสูงสุด เพื่อจะมุ่งหน้าสู่ความสำเร็จ การเทรดเองก็เหมือนกับการเล่นกีฬาอย่างมืออาชีพในการแข่งขัน โดยต้องมีความมั่นใจและการไม่หยุดนิ่ง เพื่อที่จะได้ "ผ่าน" จากสโมสร Borussia FC และขึ้นมาอยู่ในอันดับต้นไปพร้อมกับ InstaSpot!

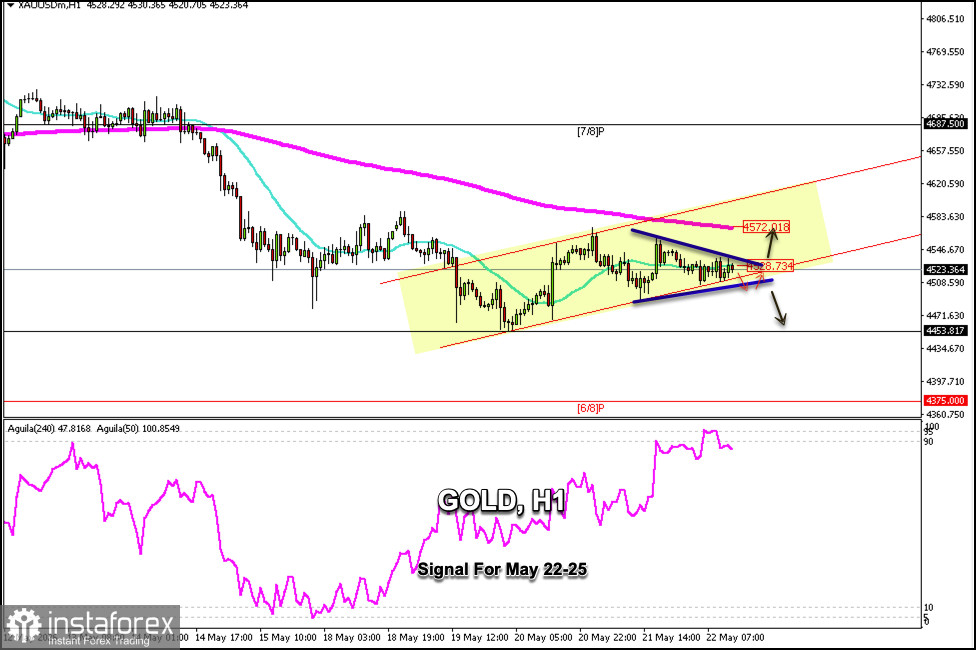
XAU/USD is trading around $4,523 within the ascending trend channel formed on the H1 chart. We could expect a technical bounce so that the price could reach the 200 EMA around $4,572.
According to the H1 chart, gold is overbought, so it may have difficulty rising above $4,530 in the coming hours, as the 21 SMA could exert downward pressure.
Gold is likely to return to $4,500 or even $4,580 if the downward pressure continues, potentially reaching the low of May 19th around $4,453.
We observe the formation of a symmetrical triangle pattern on the H1 chart. The instrument is expected to oscillate within this pattern in the coming hours, and we foresee consolidation within this area. Only a decisive break above $4,530 would be a bullish buy signal.
Conversely, a drop below $4,490 could lead to consolidation and a potential fall to $4,453.
*บทวิเคราะห์ในตลาดที่มีการโพสต์ตรงนี้ เพียงเพื่อทำให้คุณทราบถึงข้อมูล ไม่ได้เป็นการเจาะจงถึงขั้นตอนให้คุณทำการซื้อขายตาม
บทวิเคราะห์ของทาง InstaSpot จะทำให้คุณทราบถึงแนวโน้มของตลาด! ในการที่เป็นลูกค้าของทาง InstaSpot นั้นคุณจะได้รับการบริการเพื่อการซื้อขายอย่างเต็มประสิทธิภาพอย่างมากมาย


