


Kumpulan kami mempunyai lebih daripada 7,000,000 pedagang!
Setiap hari kami bekerjasama untuk meningkatkan perdagangan. Kami mendapat keputusan yang tinggi dan bergerak ke hadapan.
Pengiktirafan oleh berjuta-juta pedagang di seluruh dunia adalah penghargaan terbaik untuk kerja kami! Anda membuat pilihan anda dan kami akan melakukan segalanya yang diperlukan untuk memenuhi jangkaan anda!
Kami adalah kumpulan yang terbaik bersama!
InstaSpot. Berbangga bekerja untuk anda!


Pelakon, juara kejohanan UFC 6 dan seorang wira sebenar!
Lelaki yang membuat dirinya sendiri. Lelaki yang mengikut cara kami.
Rahsia di sebalik kejayaan Taktarov adalah pergerakan berterusan ke arah matlamat.
Dedahkan semua segi bakat anda!
Cari, cuba, gagal - tetapi tidak pernah berhenti!
InstaSpot. Kisah kejayaan anda bermula di sini!

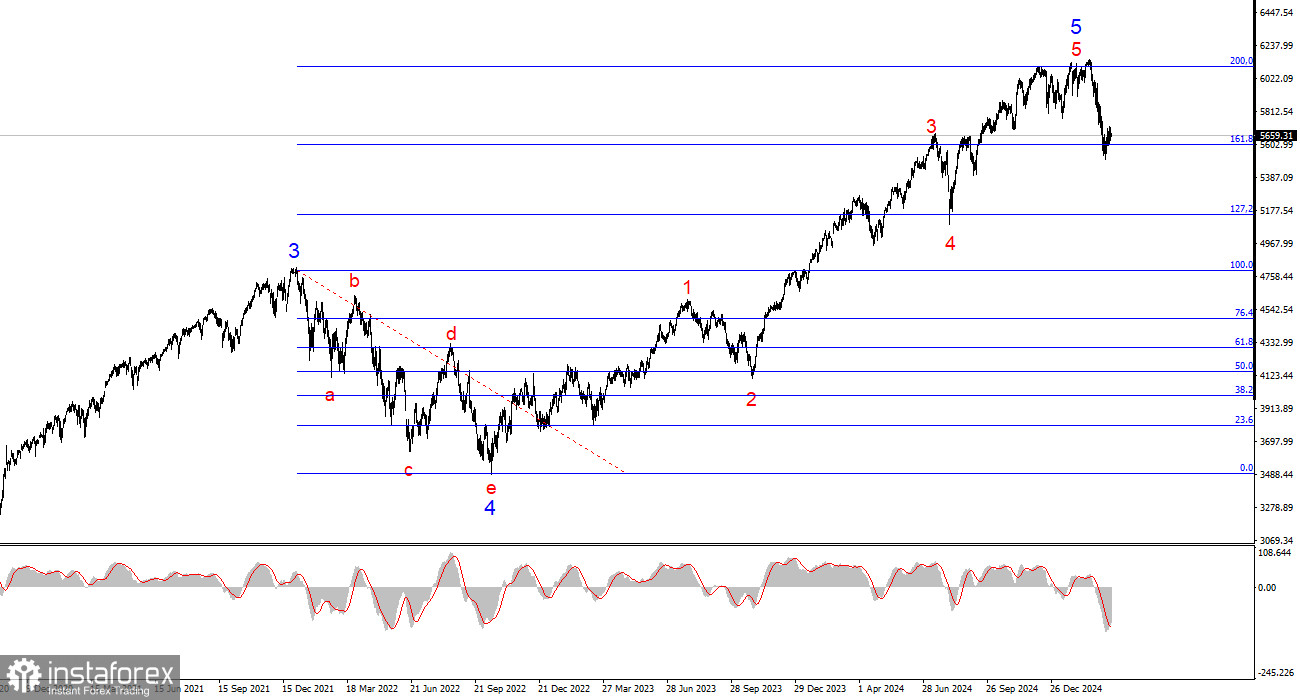
The wave structure on the 24-hour chart for #SPX is fairly clear. The first and most important point is the large-scale five-wave structure, which is so wide that it barely fits in the platform screen even at the smallest scale. In simpler terms, US stock indices have been in a long-term uptrend. But as we know, trends eventually reverse.
At this point, wave 5 of 5 appears to be complete, with the instrument making four failed attempts to break above 6,093, which corresponds to a 200.0% Fibonacci extension from wave 4. In my view, a corrective wave sequence is now unfolding. The US stock market is overheated, and more experts are warning of a "bubble."
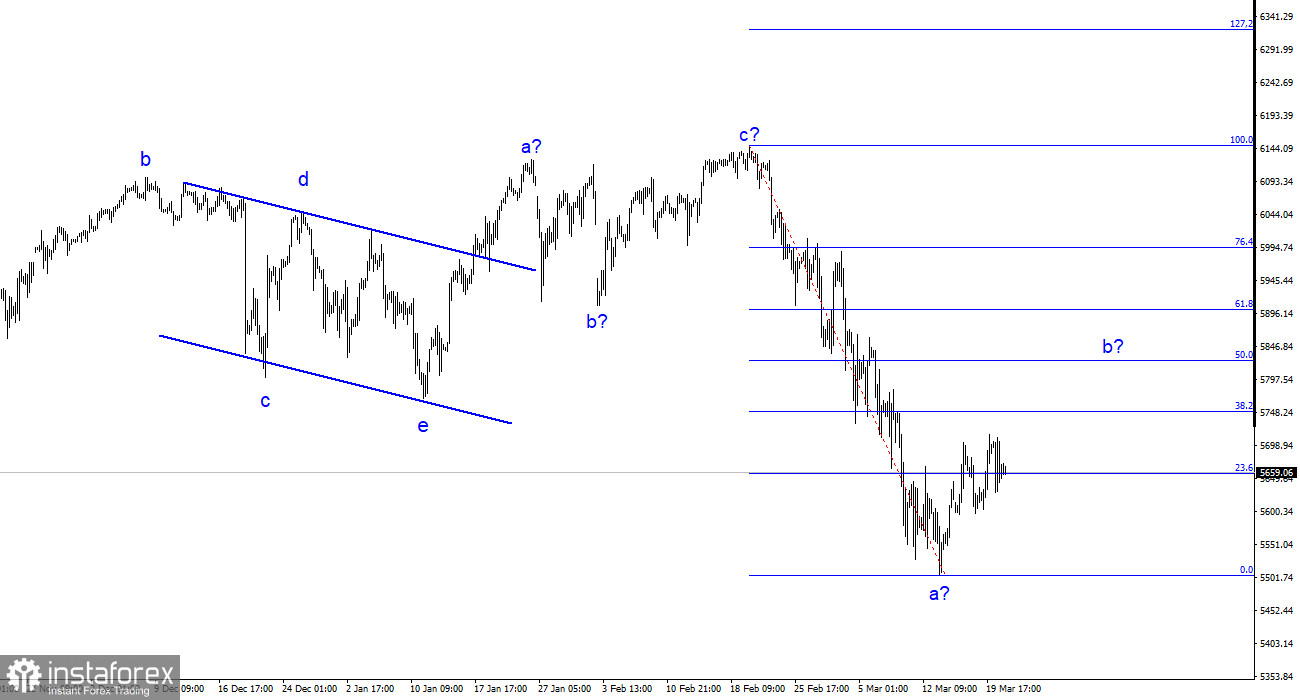
On the 4-hour chart, we see a completed complex corrective structure a-b-c-d-e, followed by an upward a-b-c pattern. This suggests that a new downward structure is now in progress, and its first wave closely resembles an impulse.
Hence, I expect an upward wave 2 or b, after which the decline is likely to resume. My current outlook is based on the daily wave count, which implies a prolonged downward movement for the S&P 500.
As I previously warned, #SPX has started forming corrective wave b, which could lift the index as high as 5,825—50.0% Fibonacci retracement of wave a. This suggests that while the US stock market may rise in the short term, it will likely be a corrective bounce before the next leg down. Of course, wave structures can evolve in many ways—the retracement could just as easily be 38.2% or even 76.4%, but we do have a baseline scenario for now.
At this week's FOMC meeting, it became clear that only the markets are panicking about Trump's tariffs—not the Federal Reserve. The Fed didn't see any significant negative changes in the economy. The regulator expects inflation to accelerate and GDP growth to lose momentum. Hence, monetary policy will likely be eased slowly, just as previously expected.
However, let me remind you that the market has already priced in the Fed's dovish stance. What matters now is the real state of the US economy and its outlook, which remains cautiously negative. Still, the Fed managed to calm the markets somewhat, though we can't ignore the obvious— the US economy is slowing down. Probably not as fast as markets fear, but slowing nonetheless. Therefore, my wave scenario remains valid.
Based on the current wave analysis of #SPX, I conclude that the instrument has completed its upward trend phase. In the current environment, I recommend watching 6,125 and Trump's economic policies. His actions—trade wars, tariffs, and import restrictions—pose risks to the stability of the US economy and corporate earnings, making a new downtrend increasingly likely.
The "bubble" in US stock markets appears fully inflated. The 4-hour chart allows for one more upward wave, followed by a bearish move. The 24-hour chart confirms the start of a larger downtrend. On the higher timeframe, the wave picture is even clearer: a clean five-wave structure, with another five-wave pattern inside the fifth wave—a classic indicator that we may be nearing the end. This all points to a lengthy and complex correction, which may have already begun.
* Analisis pasaran yang disiarkan di sini adalah bertujuan untuk meningkatkan kesedaran anda, tetapi tidak untuk memberi arahan untuk membuat perdagangan.
Kajian analisis InstaSpot akan membuat anda mengetahui sepenuhnya aliran pasaran! Sebagai pelanggan InstaSpot, anda disediakan sejumlah besar perkhidmatan percuma untuk dagangan yang cekap.


