


Kumpulan kami mempunyai lebih daripada 7,000,000 pedagang!
Setiap hari kami bekerjasama untuk meningkatkan perdagangan. Kami mendapat keputusan yang tinggi dan bergerak ke hadapan.
Pengiktirafan oleh berjuta-juta pedagang di seluruh dunia adalah penghargaan terbaik untuk kerja kami! Anda membuat pilihan anda dan kami akan melakukan segalanya yang diperlukan untuk memenuhi jangkaan anda!
Kami adalah kumpulan yang terbaik bersama!
InstaSpot. Berbangga bekerja untuk anda!


Pelakon, juara kejohanan UFC 6 dan seorang wira sebenar!
Lelaki yang membuat dirinya sendiri. Lelaki yang mengikut cara kami.
Rahsia di sebalik kejayaan Taktarov adalah pergerakan berterusan ke arah matlamat.
Dedahkan semua segi bakat anda!
Cari, cuba, gagal - tetapi tidak pernah berhenti!
InstaSpot. Kisah kejayaan anda bermula di sini!

Trend analysis (Fig. 1).
The EUR/USD currency pair may move upward from the level of 1.0937 (closing of Friday's daily candlestick) to 1.0969, the 61.8% pullback level (red dotted line). In the case of testing this level, a continued upward movement is possible to the upper fractal at 1.0981 (blue dotted line).
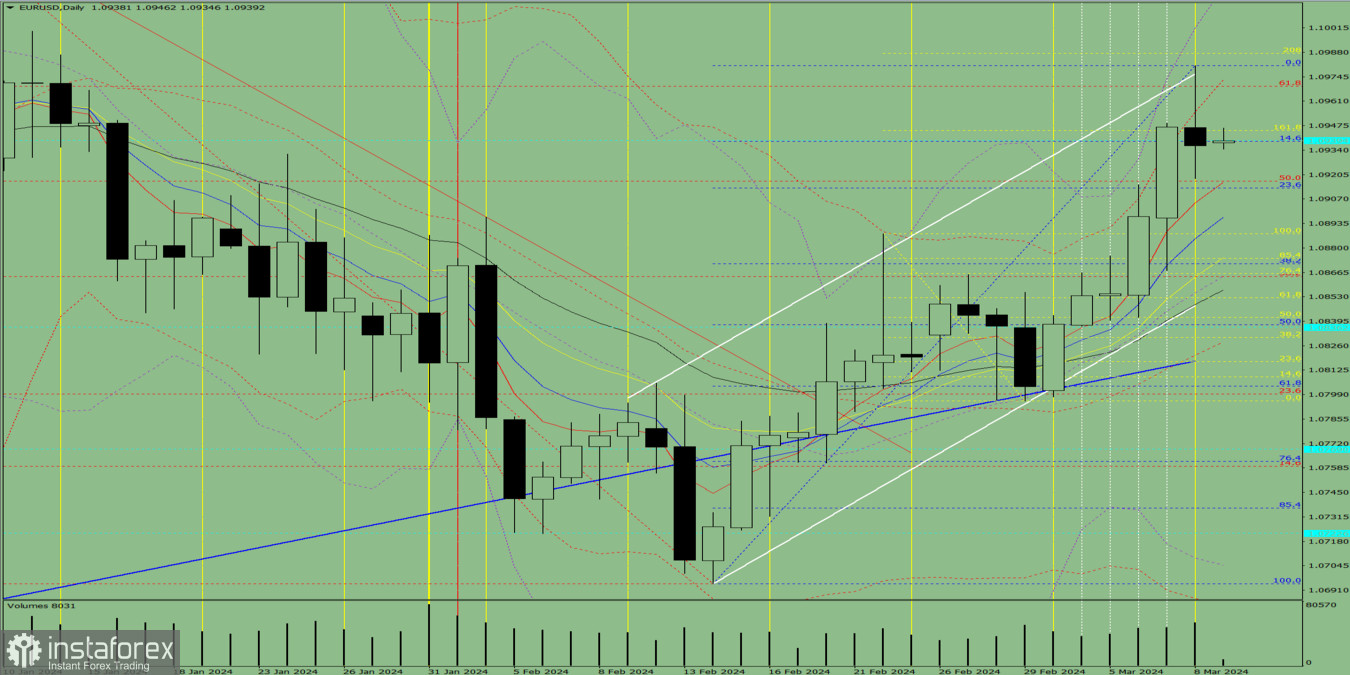
Fig. 1 (daily chart).
Comprehensive analysis:
Today, the price may move upward from the level of 1.0937 (closing of Friday's daily candlestick) to 1.0969, the 61.8% pullback level (red dotted line). In the case of testing this level, a continued upward movement is possible to the upper fractal at 1.0981 (blue dotted line).
Alternatively, from the level of 1.0937 (closing of Friday's daily candlestick), the price may move upward to 1.0969, the 61.8% pullback level (red dotted line). In the case of testing this level, a downward movement is possible to 1.0945, the 161.8% pullback level (yellow dotted line).
* Analisis pasaran yang disiarkan di sini adalah bertujuan untuk meningkatkan kesedaran anda, tetapi tidak untuk memberi arahan untuk membuat perdagangan.
Kajian analisis InstaSpot akan membuat anda mengetahui sepenuhnya aliran pasaran! Sebagai pelanggan InstaSpot, anda disediakan sejumlah besar perkhidmatan percuma untuk dagangan yang cekap.


