


Nella nostra squadra ci sono più di 7.000.000 trader! Ogni giorno ci impegniamo a far sì che il trading migliori. Conseguiamo grandi risultati e ci muoviamo in avanti.
Il riconoscimento da parte di milioni di trader in tutto il mondo rappresenta l'alta valutazione della nostra attività! Voi avete fatto la vostra scelta e noi faremo la nostra al fine di soddisfare le vostre aspettative!
Assieme siamo una grande squadra!
InstaSpot. Siamo orgogliosi di lavorare per voi!


Attore, campione del mondo di lotta libera e semplicemente un vero maciste russo! Persona venuta dal nulla. Persona che rispecchia i nostri obiettivi. Il segreto del successo di Taktarov consiste nel mirare continuamente al suo scopo.
Dischiudi anche tu tutti gli aspetti del tuo talento! Impara, prova, sbaglia, ma non fermarti!
InstaSpot - la storia delle tue vittorie inizia qui!

Trend analysis (Fig. 1).
The EUR/USD currency pair may move upward from the level of 1.0937 (closing of Friday's daily candlestick) to 1.0969, the 61.8% pullback level (red dotted line). In the case of testing this level, a continued upward movement is possible to the upper fractal at 1.0981 (blue dotted line).
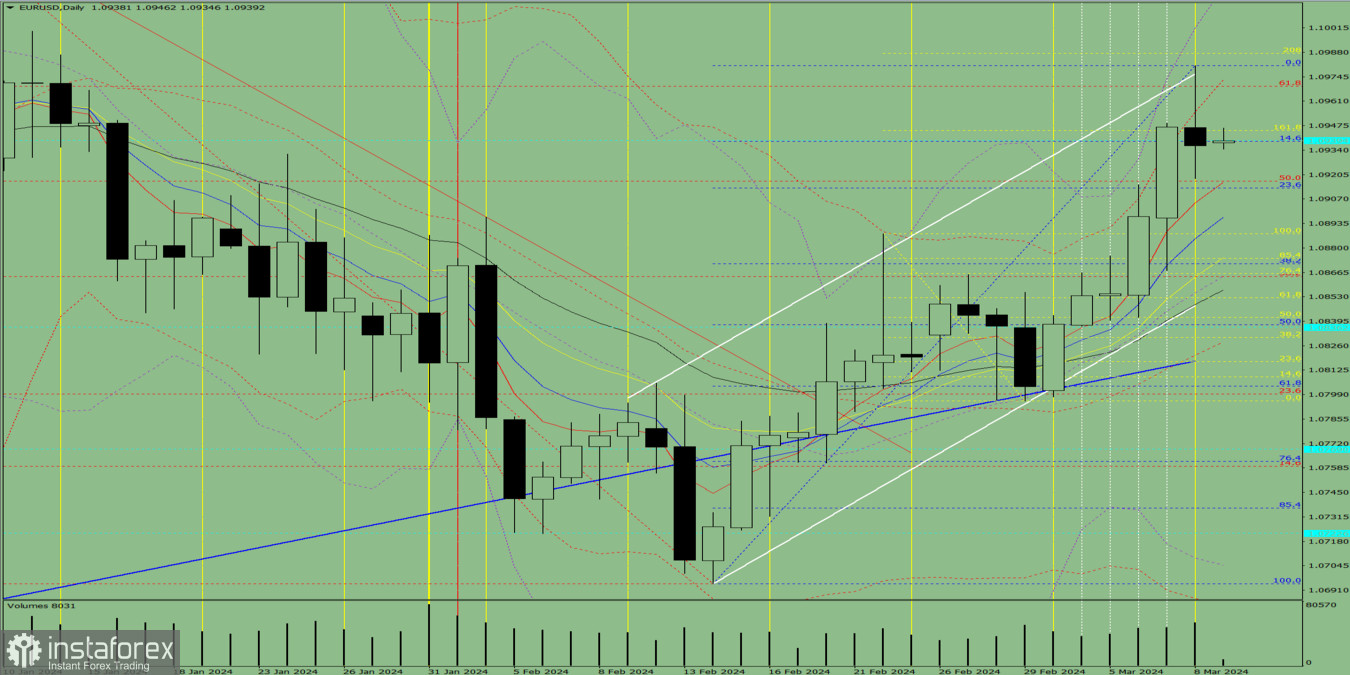
Fig. 1 (daily chart).
Comprehensive analysis:
Today, the price may move upward from the level of 1.0937 (closing of Friday's daily candlestick) to 1.0969, the 61.8% pullback level (red dotted line). In the case of testing this level, a continued upward movement is possible to the upper fractal at 1.0981 (blue dotted line).
Alternatively, from the level of 1.0937 (closing of Friday's daily candlestick), the price may move upward to 1.0969, the 61.8% pullback level (red dotted line). In the case of testing this level, a downward movement is possible to 1.0945, the 161.8% pullback level (yellow dotted line).
*La presente analisi del mercato ha un carattere esclusivamente informativo e non rappresenta una guida per l`effettuazione di una transazione.
Le recensioni analitiche di InstaSpot ti renderanno pienamente consapevole delle tendenze del mercato! Essendo un cliente InstaSpot, ti viene fornito un gran numero di servizi gratuiti per il trading efficiente.


