


Kumpulan kami mempunyai lebih daripada 7,000,000 pedagang!
Setiap hari kami bekerjasama untuk meningkatkan perdagangan. Kami mendapat keputusan yang tinggi dan bergerak ke hadapan.
Pengiktirafan oleh berjuta-juta pedagang di seluruh dunia adalah penghargaan terbaik untuk kerja kami! Anda membuat pilihan anda dan kami akan melakukan segalanya yang diperlukan untuk memenuhi jangkaan anda!
Kami adalah kumpulan yang terbaik bersama!
InstaSpot. Berbangga bekerja untuk anda!


Pelakon, juara kejohanan UFC 6 dan seorang wira sebenar!
Lelaki yang membuat dirinya sendiri. Lelaki yang mengikut cara kami.
Rahsia di sebalik kejayaan Taktarov adalah pergerakan berterusan ke arah matlamat.
Dedahkan semua segi bakat anda!
Cari, cuba, gagal - tetapi tidak pernah berhenti!
InstaSpot. Kisah kejayaan anda bermula di sini!

EUR/USD
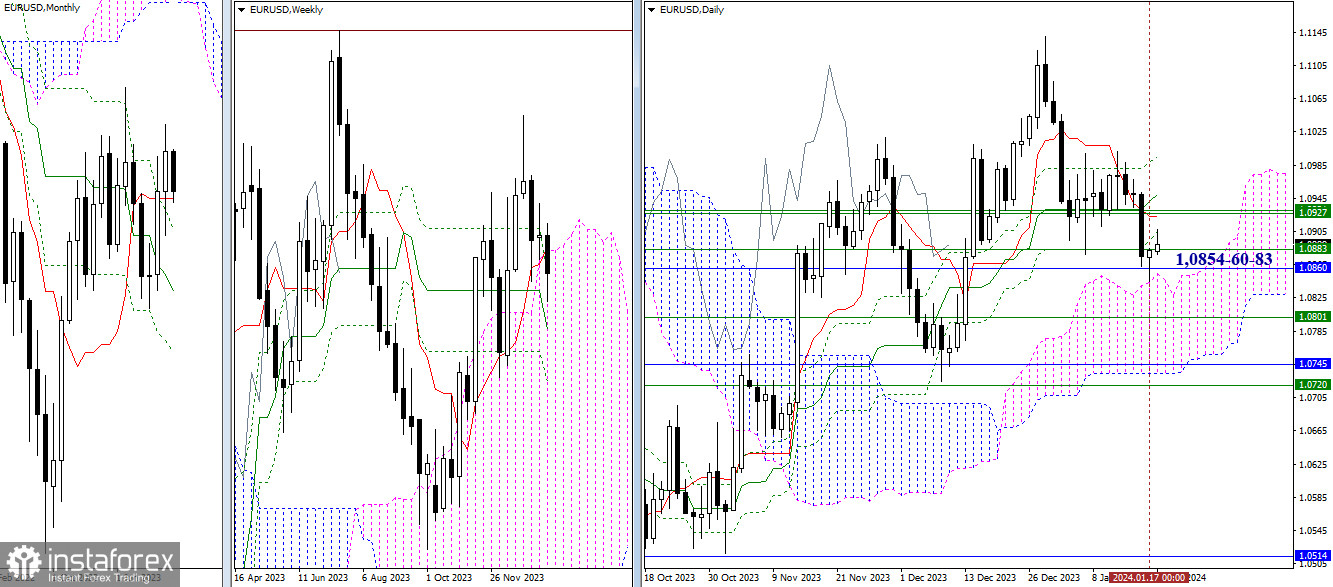
Higher Timeframes
Upon testing the encountered supports (1.0860 – 1.0854), a rebound formed, but the range of yesterday's movement was insignificant, so the strength of the rebound was not great. Currently, a retest of the final level of the daily cross (1.0905) is being executed. If further recovery of positions continues, bulls will test daily (1.0923 – 1.0950 – 1.0995) and weekly (1.0927 – 1.0932) levels, which they quite easily lost the day before. A breach of 1.0860-54 will open new perspectives, with the next support being the weekly medium-term trend (1.0801).
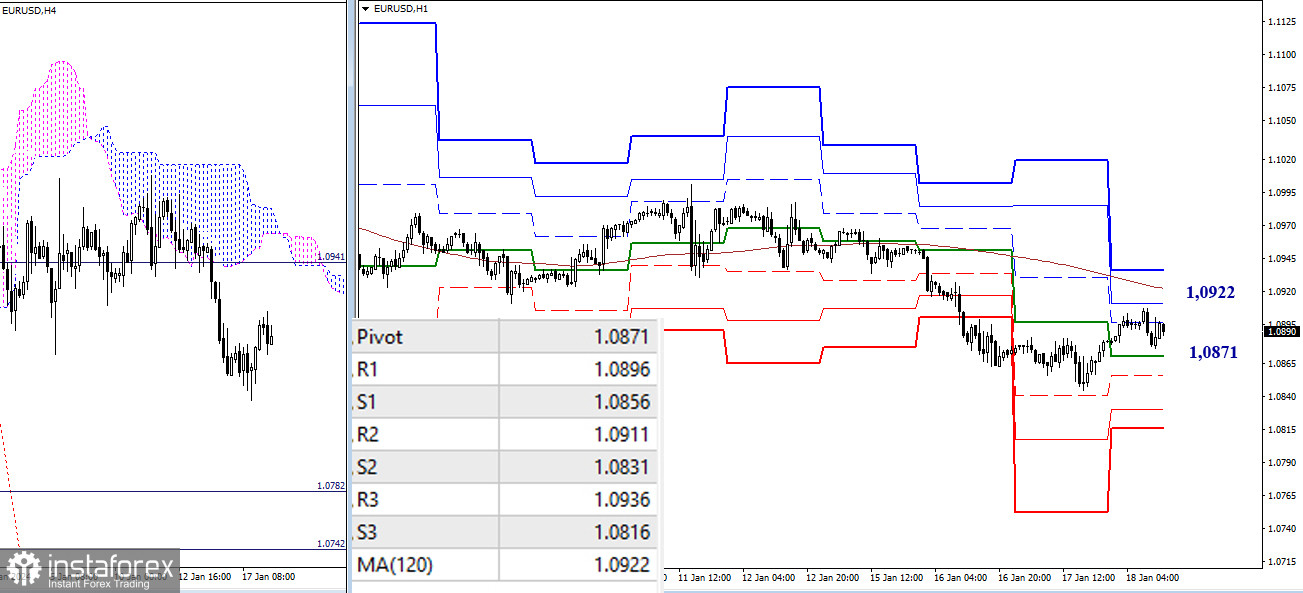
H4 – H1
The emerging upward correction from yesterday has developed further. On the lower timeframes, the pair is now in the correction zone. The most important benchmark is the indicator of the weekly long-term trend (1.0922). Consolidation above and a reversal of the moving average can once again significantly change the existing balance of power in favor of the bulls. In this case, the classic pivot point, located today at 1.0936 (R3), will serve as a benchmark within the day. If the corrective rise is halted, the return of the downward trend will occur by overcoming 1.0871 – 1.0856 (supports of classic pivot points) – 1.0845 (correction low).
***
GBP/USD
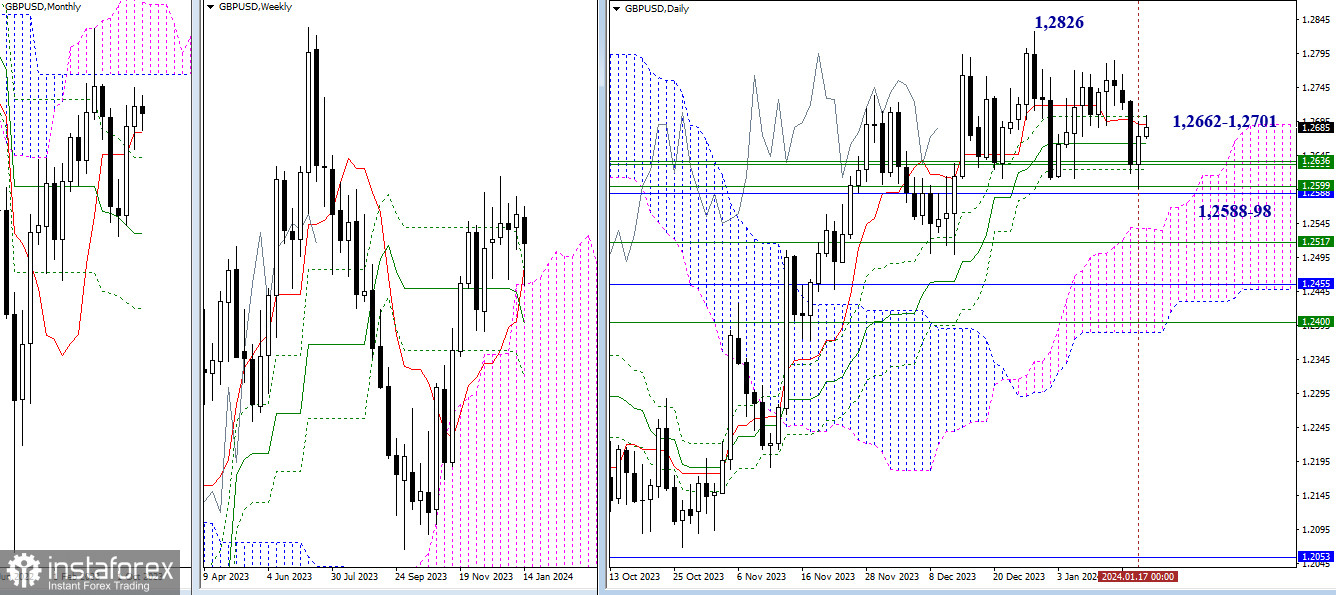
Higher Timeframes
After testing the supports at 1.2588 (monthly short-term trend) – 1.2598 (upper boundary of the weekly cloud), the pound executed a rebound, encountering previously passed levels of the daily cross of Ichimoku (1.2662 – 1.2701). After consolidating above, bullish interest will shift to renewing highs (1.2784 – 1.2826). If the bulls again find themselves lacking strength, the pair will face the supports at 1.2624-36 and 1.2588-98, tested the day before.
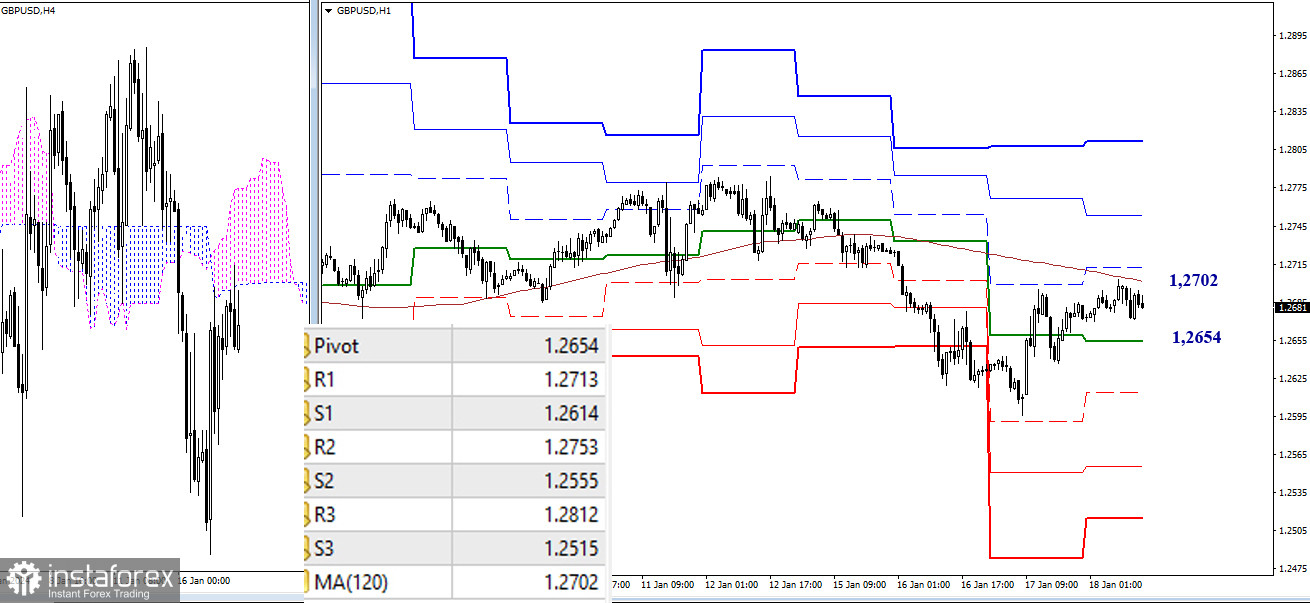
H4 – H1
On the lower timeframes, bulls have approached a key level – the weekly long-term trend. This level dictates current preferences. Whoever owns the trend can strengthen their sentiments. Consolidation above and an upward reversal of the moving average will give the advantage to bulls. Their benchmarks will be the resistances of classic pivot points (1.2713 – 1.2753 – 1.2812). Trading below the long-term trend will maintain the possibilities of strengthening bearish sentiments. Current benchmarks are the supports of classic pivot points (1.2654 – 1.2614 – 1.2555 – 1.2515).
***
The technical analysis of the situation uses:
Higher timeframes - Ichimoku Kinko Hyo (9.26.52) + Fibonacci Kijun levels
Lower timeframes - H1 - Pivot Points (classic) + Moving Average 120 (weekly long-term trend)
* Analisis pasaran yang disiarkan di sini adalah bertujuan untuk meningkatkan kesedaran anda, tetapi tidak untuk memberi arahan untuk membuat perdagangan.
Kajian analisis InstaSpot akan membuat anda mengetahui sepenuhnya aliran pasaran! Sebagai pelanggan InstaSpot, anda disediakan sejumlah besar perkhidmatan percuma untuk dagangan yang cekap.


