


The legend in the InstaSpot team!
Legend! You think that's bombastic rhetoric? But how should we call a man, who became the first Asian to win the junior world chess championship at 18 and who became the first Indian Grandmaster at 19? That was the start of a hard path to the World Champion title for Viswanathan Anand, the man who became a part of history of chess forever. Now one more legend in the InstaSpot team!


Borussia is one of the most titled football clubs in Germany, which has repeatedly proved to fans: the spirit of competition and leadership will certainly lead to success. Trade in the same way that sports professionals play the game: confidently and actively. Keep a "pass" from Borussia FC and be in the lead with InstaSpot!
EUR/USD
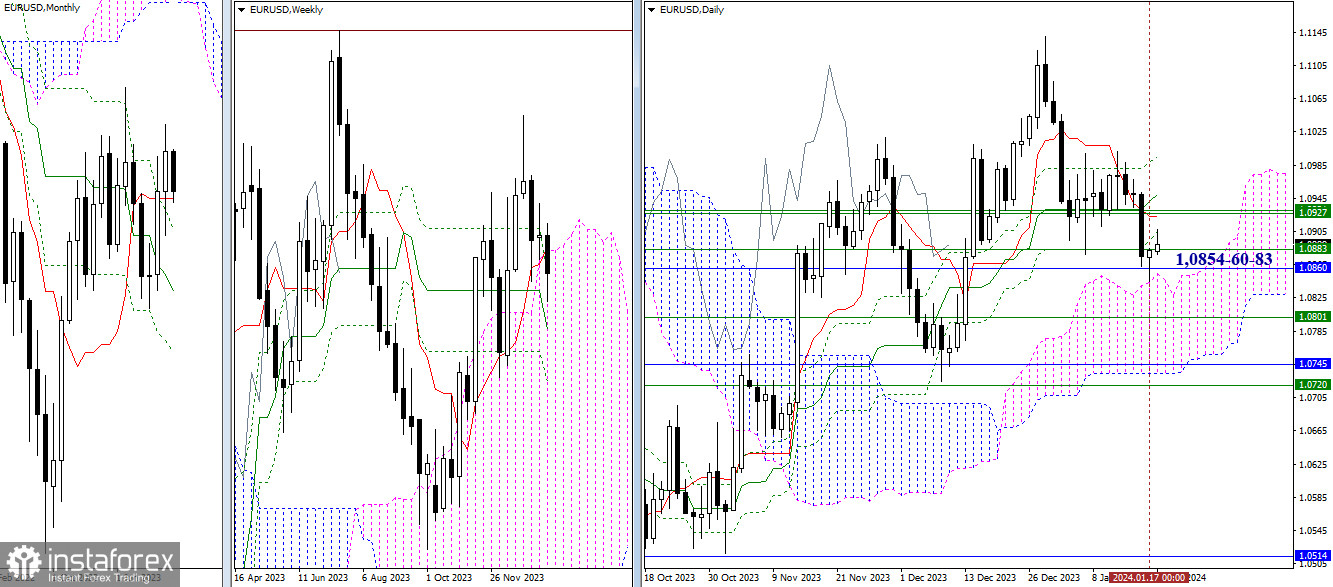
Higher Timeframes
Upon testing the encountered supports (1.0860 – 1.0854), a rebound formed, but the range of yesterday's movement was insignificant, so the strength of the rebound was not great. Currently, a retest of the final level of the daily cross (1.0905) is being executed. If further recovery of positions continues, bulls will test daily (1.0923 – 1.0950 – 1.0995) and weekly (1.0927 – 1.0932) levels, which they quite easily lost the day before. A breach of 1.0860-54 will open new perspectives, with the next support being the weekly medium-term trend (1.0801).
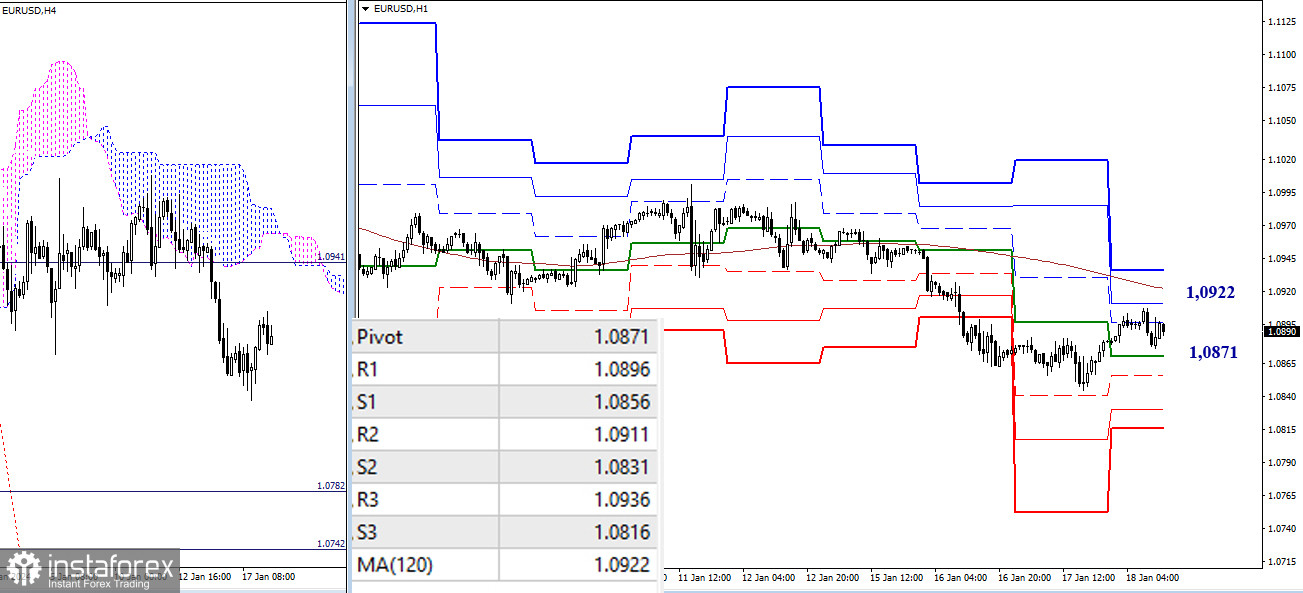
H4 – H1
The emerging upward correction from yesterday has developed further. On the lower timeframes, the pair is now in the correction zone. The most important benchmark is the indicator of the weekly long-term trend (1.0922). Consolidation above and a reversal of the moving average can once again significantly change the existing balance of power in favor of the bulls. In this case, the classic pivot point, located today at 1.0936 (R3), will serve as a benchmark within the day. If the corrective rise is halted, the return of the downward trend will occur by overcoming 1.0871 – 1.0856 (supports of classic pivot points) – 1.0845 (correction low).
***
GBP/USD
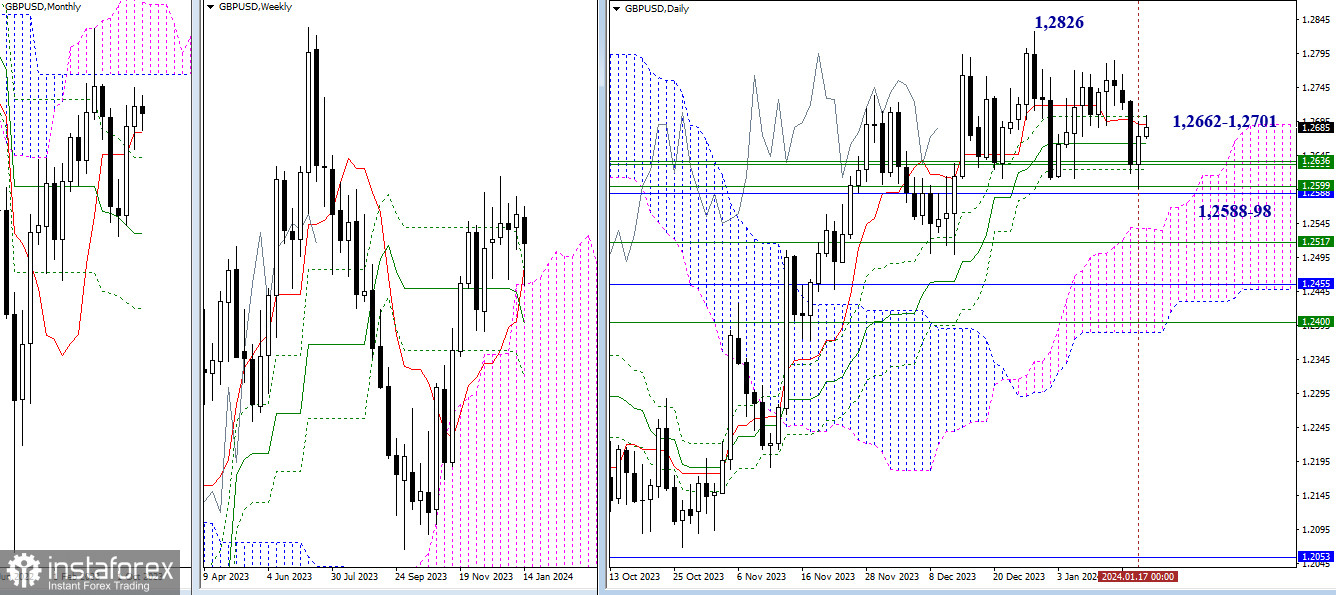
Higher Timeframes
After testing the supports at 1.2588 (monthly short-term trend) – 1.2598 (upper boundary of the weekly cloud), the pound executed a rebound, encountering previously passed levels of the daily cross of Ichimoku (1.2662 – 1.2701). After consolidating above, bullish interest will shift to renewing highs (1.2784 – 1.2826). If the bulls again find themselves lacking strength, the pair will face the supports at 1.2624-36 and 1.2588-98, tested the day before.
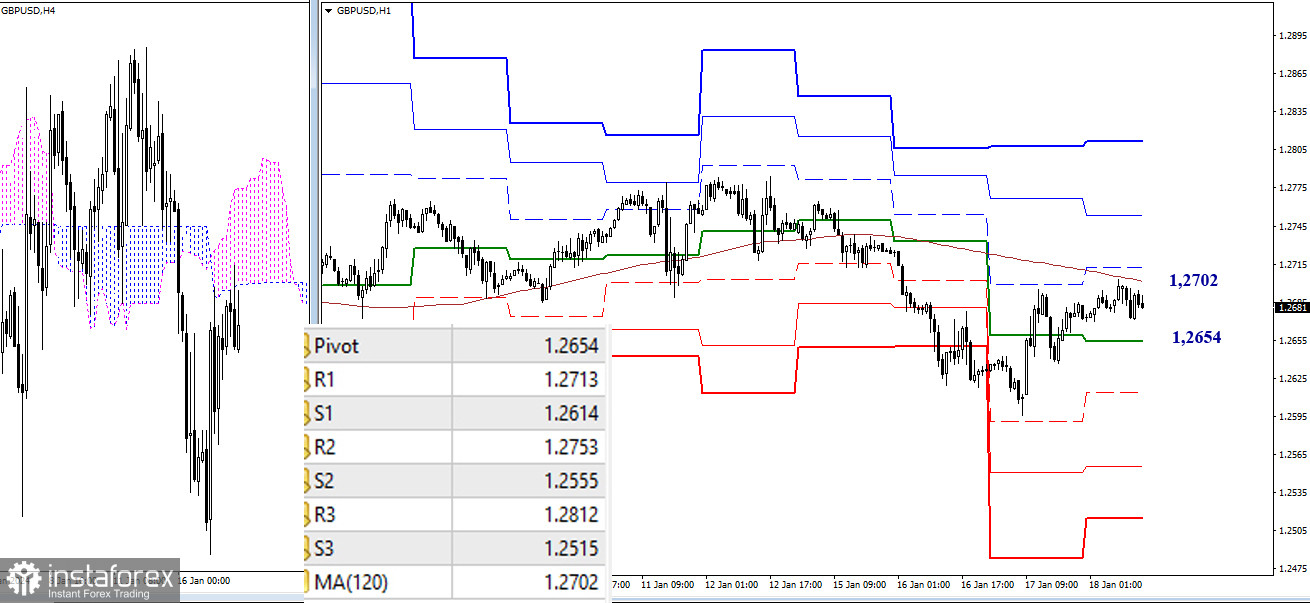
H4 – H1
On the lower timeframes, bulls have approached a key level – the weekly long-term trend. This level dictates current preferences. Whoever owns the trend can strengthen their sentiments. Consolidation above and an upward reversal of the moving average will give the advantage to bulls. Their benchmarks will be the resistances of classic pivot points (1.2713 – 1.2753 – 1.2812). Trading below the long-term trend will maintain the possibilities of strengthening bearish sentiments. Current benchmarks are the supports of classic pivot points (1.2654 – 1.2614 – 1.2555 – 1.2515).
***
The technical analysis of the situation uses:
Higher timeframes - Ichimoku Kinko Hyo (9.26.52) + Fibonacci Kijun levels
Lower timeframes - H1 - Pivot Points (classic) + Moving Average 120 (weekly long-term trend)
*这里的市场分析是为了增加您对市场的了解,而不是给出交易的指示。
InstaSpot分析评论将让您充分了解市场趋势! 作为InstaSpot的客户,您将获得大量的免费服务以实现有效的交易。


