


Legenda dalam pasukan InstaSpot!
Legenda! Anda fikir ia adalah satu retorik yang besar? Tetapi bagaimana untuk kita memanggil seorang lelaki, yang telah menjadi pemain Asia pertama yang memenangi kejohanan catur dunia junior pada usia 18 tahun dan menjadi Grandmaster India pertama pada usia 19 tahun? Itulah permulaan yang sukar untuk merangkul gelaran Juara Dunia untuk Viswanathan Anand, seorang juara yang telah menjadi sebahagian daripada sejarah catur. Kini satu lagi legenda dalam pasukan InstaSpot!


Borussia adalah salah satu kelab bola sepak paling terkemuka di Jerman, yang telah berulang kali membuktikan kepada peminatnya: semangat persaingan dan kepemimpinan pasti akan membawa kepada kejayaan. Berdagang dengan cara yang sama seperti atlet sukan profesional beraksi menentang lawan: yakin dan aktif. Simpan "hantaran" dari Borussia FC dan menjadi pedagang hebat dengan InstaSpot!


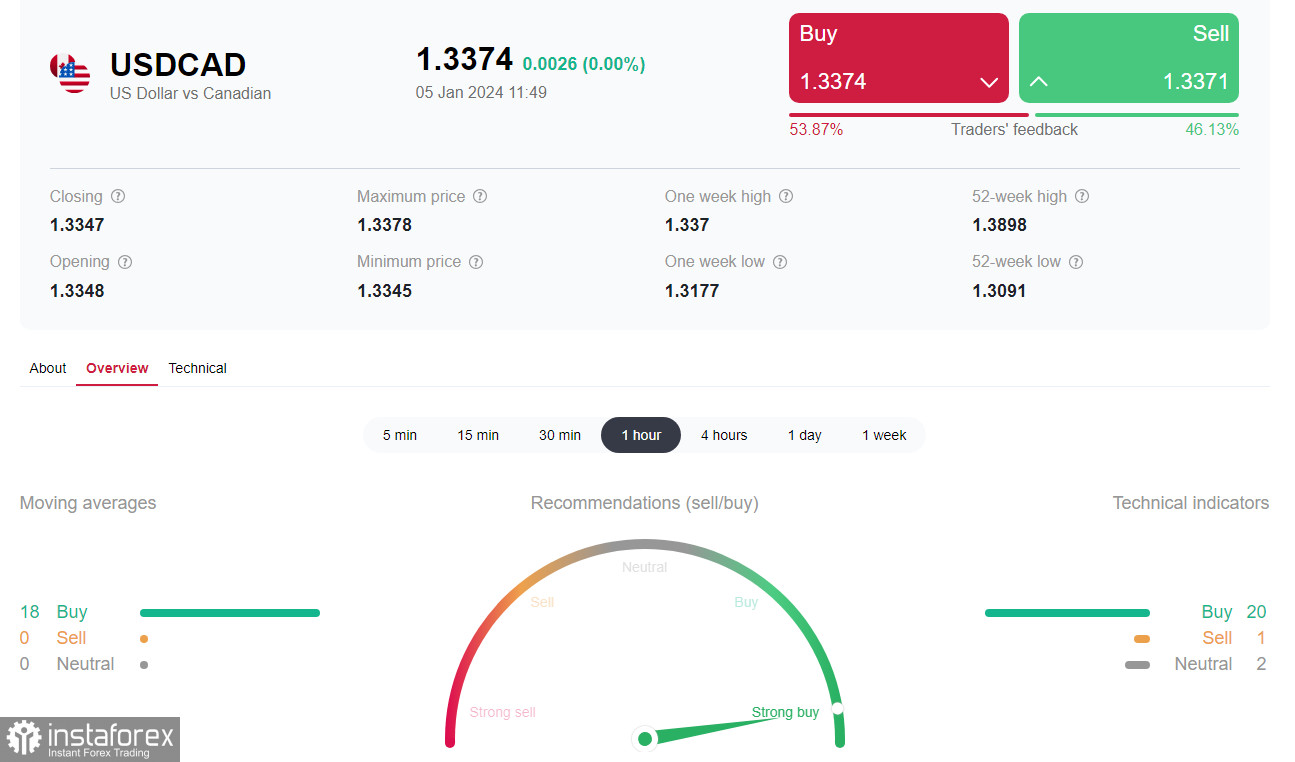
The USD/CAD is rising ahead of the release of labor market data from the USA and Canada at 13:30 GMT. As of writing, the pair was trading near the 1.3373 mark, accelerating in the short-term bullish market zone, above the 1.3312 support level (200 EMA on the 1-hour chart).
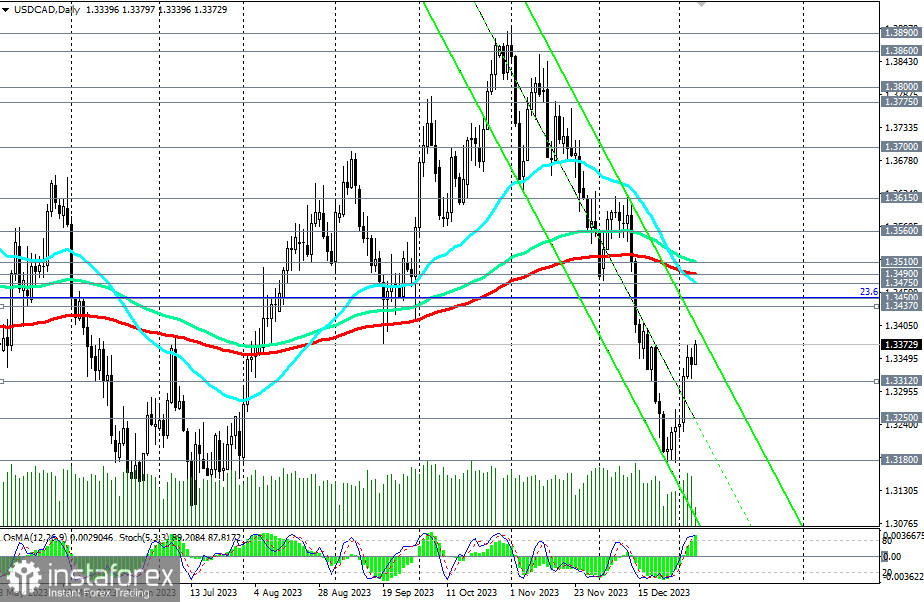
The pair is developing an upward correction within the medium-term bearish trend and the downward channel on the daily chart, while remaining in the long-term bullish market zone – above the key support level of 1.3180 (200 EMA on the weekly chart).
In our opinion, the dynamics of the USD/CAD are currently most influenced by the dynamics of the American dollar. Therefore, in the case of a strong U.S. Department of Labor report, further strengthening of the USD and growth of the USD/CAD pair should be expected.
Breaking today's intraday high could signal the accumulation of long positions.
However, when opening long positions, it is also important not to forget about limiting stop losses, which can be placed below today's low of 1.3340.
The nearest growth targets here will be the resistance levels of 1.3437 (200 EMA on the 4-hour chart), 1.3450 (23.6% Fibonacci level in the growth wave from the level of 0.9700 to the level of 1.4600, reached in June 2016).
Meanwhile, breaking the resistance level of 1.3490 (200 EMA on the daily chart) will mark the complete restoration of the long-term bullish trend.
In an alternative scenario, the price will break the important short-term support level of 1.3312 and continue to decline towards the key support level of 1.3180, which separates the long-term bullish market from the bearish one.
Its break, in turn, will return USD/CAD to the zone of the long-term bearish market.
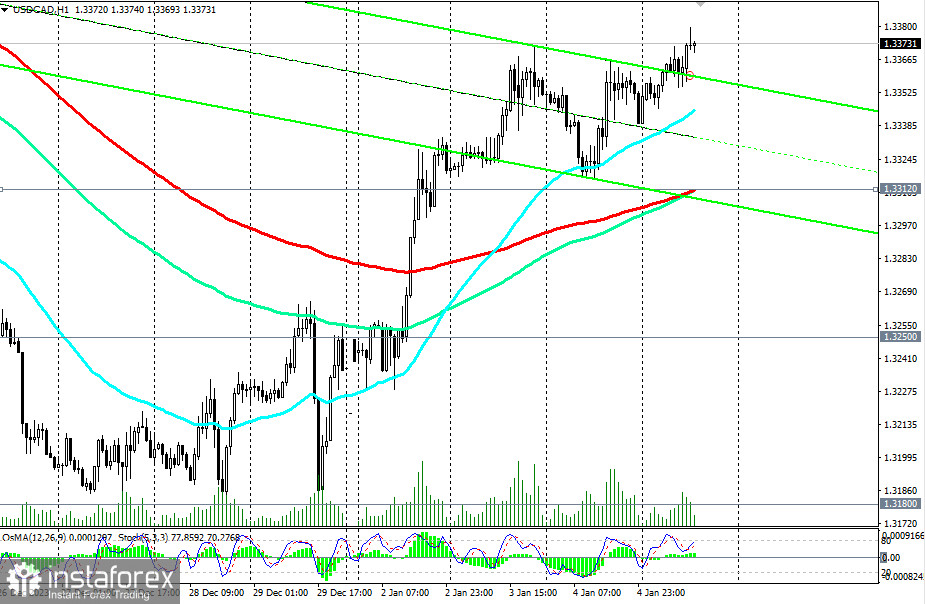
The earliest signal for the realization of this scenario could be the break of today's low of 1.3340.
Support levels: 1.3340, 1.3312, 1.3300, 1.3250, 1.3200, 1.3180.
Resistance levels: 1.3380, 1.3400, 1.3437, 1.3450, 1.3475, 1.3490, 1.3510, 1.3560, 1.3600, 1.3615, 1.3700, 1.3775, 1.3800, 1.3860, 1.3890, 1.3900, 1.3970, 1.4000.
Trading Scenarios
Alternative scenario: Sell Stop 1.3330. Stop-Loss 1.3390. Targets 1.3312, 1.3300, 1.3250, 1.3200, 1.3180.
Main scenario: Buy Stop 1.3390. Stop-Loss 1.3330. Targets 1.3400, 1.3437, 1.3450, 1.3475, 1.3490, 1.3510, 1.3560, 1.3600, 1.3615, 1.3700, 1.3775, 1.3800, 1.3860, 1.3890, 1.3900, 1.3970, 1.4000.
"Targets" correspond to support/resistance levels. This does not mean that they will necessarily be reached, but they can serve as a guide when planning and placing your trading positions.
* Analisis pasaran yang disiarkan di sini adalah bertujuan untuk meningkatkan kesedaran anda, tetapi tidak untuk memberi arahan untuk membuat perdagangan.
Kajian analisis InstaSpot akan membuat anda mengetahui sepenuhnya aliran pasaran! Sebagai pelanggan InstaSpot, anda disediakan sejumlah besar perkhidmatan percuma untuk dagangan yang cekap.


