


الأسطورة فى فريق إنستافوركس!
الأسطورة! هل تعتقد أن هذا هو الخطاب المنمق؟ ولكن كيف ينبغي أن نطلق على الرجل، الذي أصبح أول آسيوي يفوز ببطولة العالم للشطرنج للشباب بعمر 18 سنة والذي أصبح أول أستاذ كبير هندي في سن 19؟ وكانت هذه بداية طريق صعب إلى لقب بطل العالم لـ فيسواناثان أناند، الرجل الذي أصبح جزءًا من تاريخ الشطرنج إلى الأبد. والآن أسطورة آخر في فريق إنستافوركس!


يعتبر بوروسيا دورتموند أحد أكثر أندية كرة القدم حصولاً على الألقاب في ألمانيا، وقد أثبت ذلك مرارًا وتكرارًا للجماهير: فإنّ روح المنافسة والقيادة ستؤدي بالتأكيد إلى النجاح. قم بالتداول بنفس الطريقة التي يلعب بها المحترفون الرياضيون اللعبة: بثقة ونشاط. احتفظ بـ "ترخيص دخول" من نادي بوروسيا دورتموند لكرة القدم وكن في الصدارة مع إنستافوركس!

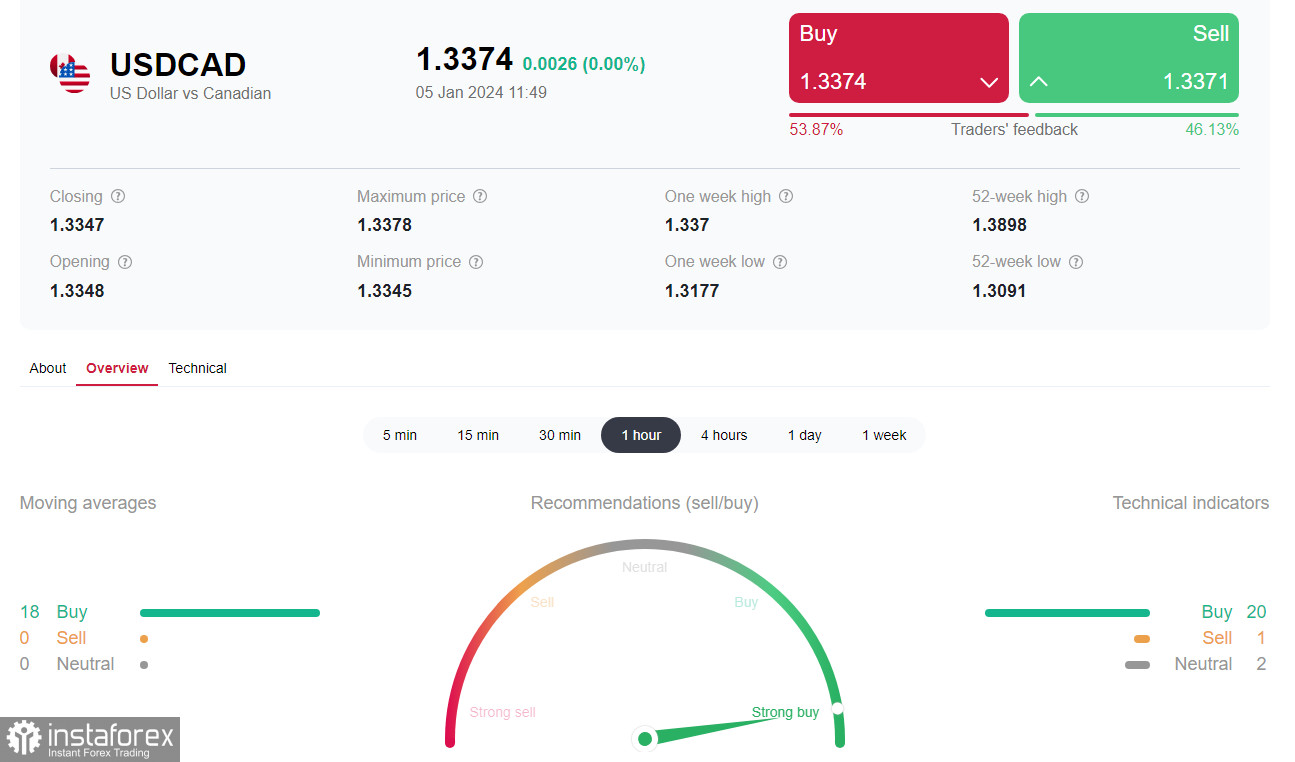
The USD/CAD is rising ahead of the release of labor market data from the USA and Canada at 13:30 GMT. As of writing, the pair was trading near the 1.3373 mark, accelerating in the short-term bullish market zone, above the 1.3312 support level (200 EMA on the 1-hour chart).
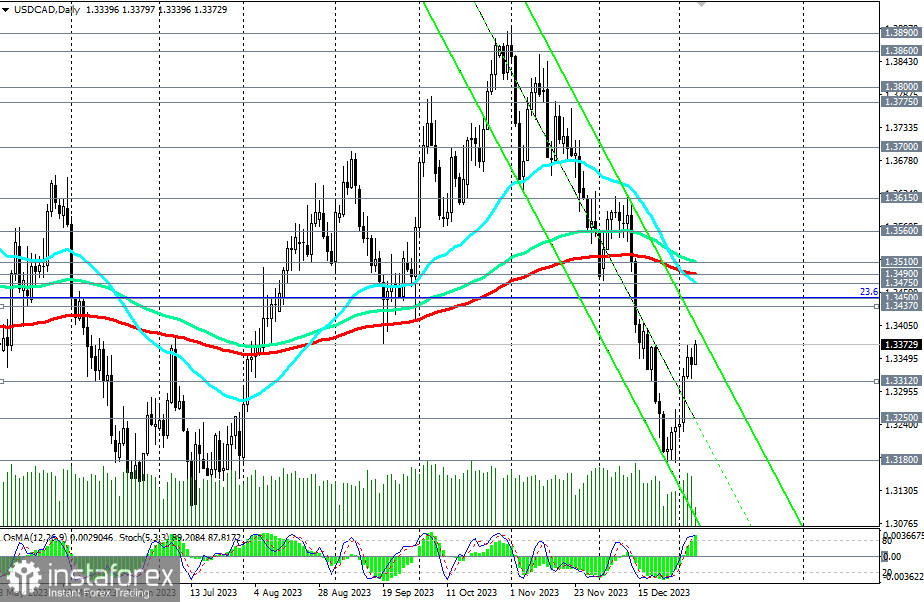
The pair is developing an upward correction within the medium-term bearish trend and the downward channel on the daily chart, while remaining in the long-term bullish market zone – above the key support level of 1.3180 (200 EMA on the weekly chart).
In our opinion, the dynamics of the USD/CAD are currently most influenced by the dynamics of the American dollar. Therefore, in the case of a strong U.S. Department of Labor report, further strengthening of the USD and growth of the USD/CAD pair should be expected.
Breaking today's intraday high could signal the accumulation of long positions.
However, when opening long positions, it is also important not to forget about limiting stop losses, which can be placed below today's low of 1.3340.
The nearest growth targets here will be the resistance levels of 1.3437 (200 EMA on the 4-hour chart), 1.3450 (23.6% Fibonacci level in the growth wave from the level of 0.9700 to the level of 1.4600, reached in June 2016).
Meanwhile, breaking the resistance level of 1.3490 (200 EMA on the daily chart) will mark the complete restoration of the long-term bullish trend.
In an alternative scenario, the price will break the important short-term support level of 1.3312 and continue to decline towards the key support level of 1.3180, which separates the long-term bullish market from the bearish one.
Its break, in turn, will return USD/CAD to the zone of the long-term bearish market.
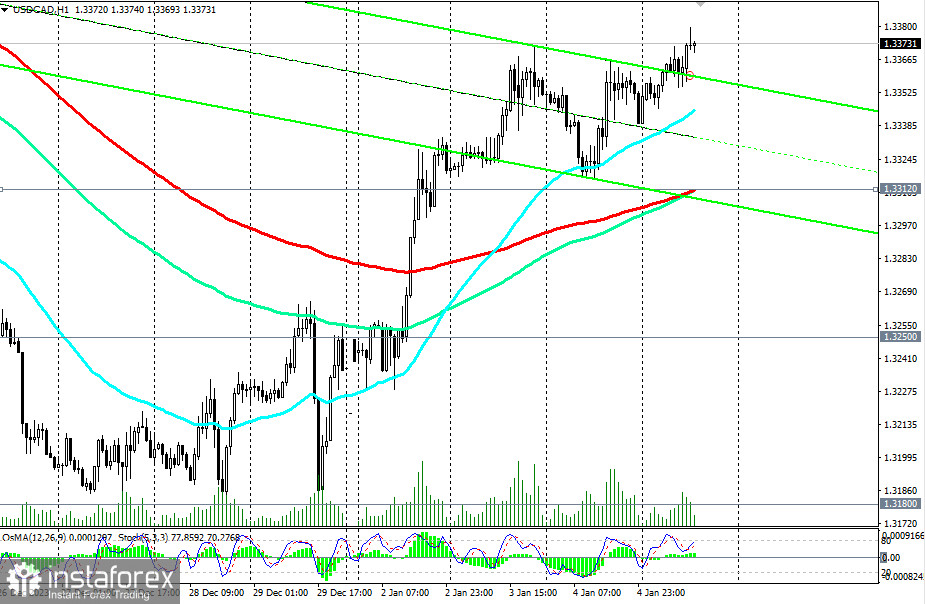
The earliest signal for the realization of this scenario could be the break of today's low of 1.3340.
Support levels: 1.3340, 1.3312, 1.3300, 1.3250, 1.3200, 1.3180.
Resistance levels: 1.3380, 1.3400, 1.3437, 1.3450, 1.3475, 1.3490, 1.3510, 1.3560, 1.3600, 1.3615, 1.3700, 1.3775, 1.3800, 1.3860, 1.3890, 1.3900, 1.3970, 1.4000.
Trading Scenarios
Alternative scenario: Sell Stop 1.3330. Stop-Loss 1.3390. Targets 1.3312, 1.3300, 1.3250, 1.3200, 1.3180.
Main scenario: Buy Stop 1.3390. Stop-Loss 1.3330. Targets 1.3400, 1.3437, 1.3450, 1.3475, 1.3490, 1.3510, 1.3560, 1.3600, 1.3615, 1.3700, 1.3775, 1.3800, 1.3860, 1.3890, 1.3900, 1.3970, 1.4000.
"Targets" correspond to support/resistance levels. This does not mean that they will necessarily be reached, but they can serve as a guide when planning and placing your trading positions.
*The market analysis posted here is meant to increase your awareness, but not to give instructions to make a trade.
InstaSpot analytical reviews will make you fully aware of market trends! Being an InstaSpot client, you are provided with a large number of free services for efficient trading.


