


Legenda dalam pasukan InstaSpot!
Legenda! Anda fikir ia adalah satu retorik yang besar? Tetapi bagaimana untuk kita memanggil seorang lelaki, yang telah menjadi pemain Asia pertama yang memenangi kejohanan catur dunia junior pada usia 18 tahun dan menjadi Grandmaster India pertama pada usia 19 tahun? Itulah permulaan yang sukar untuk merangkul gelaran Juara Dunia untuk Viswanathan Anand, seorang juara yang telah menjadi sebahagian daripada sejarah catur. Kini satu lagi legenda dalam pasukan InstaSpot!


Borussia adalah salah satu kelab bola sepak paling terkemuka di Jerman, yang telah berulang kali membuktikan kepada peminatnya: semangat persaingan dan kepemimpinan pasti akan membawa kepada kejayaan. Berdagang dengan cara yang sama seperti atlet sukan profesional beraksi menentang lawan: yakin dan aktif. Simpan "hantaran" dari Borussia FC dan menjadi pedagang hebat dengan InstaSpot!

The UK labor market data showed an increase in the unemployment rate to 4.2%, contrary to analysts' forecasts of maintaining the current level at 4.0%. The number of employed people decreased by 66,000 in June, while an increase of 75,000 was expected. Even though these labor market data were not the most favorable, the pound sterling did not show any reaction to them.
During the American trading session, data on retail sales in the United States were published, which turned out to be better than forecasts for July. Analysts expected retail sales growth to slow from 1.5% to 1.0%, but their pace accelerated to 3.2%. This news managed to support the dollar in the market.
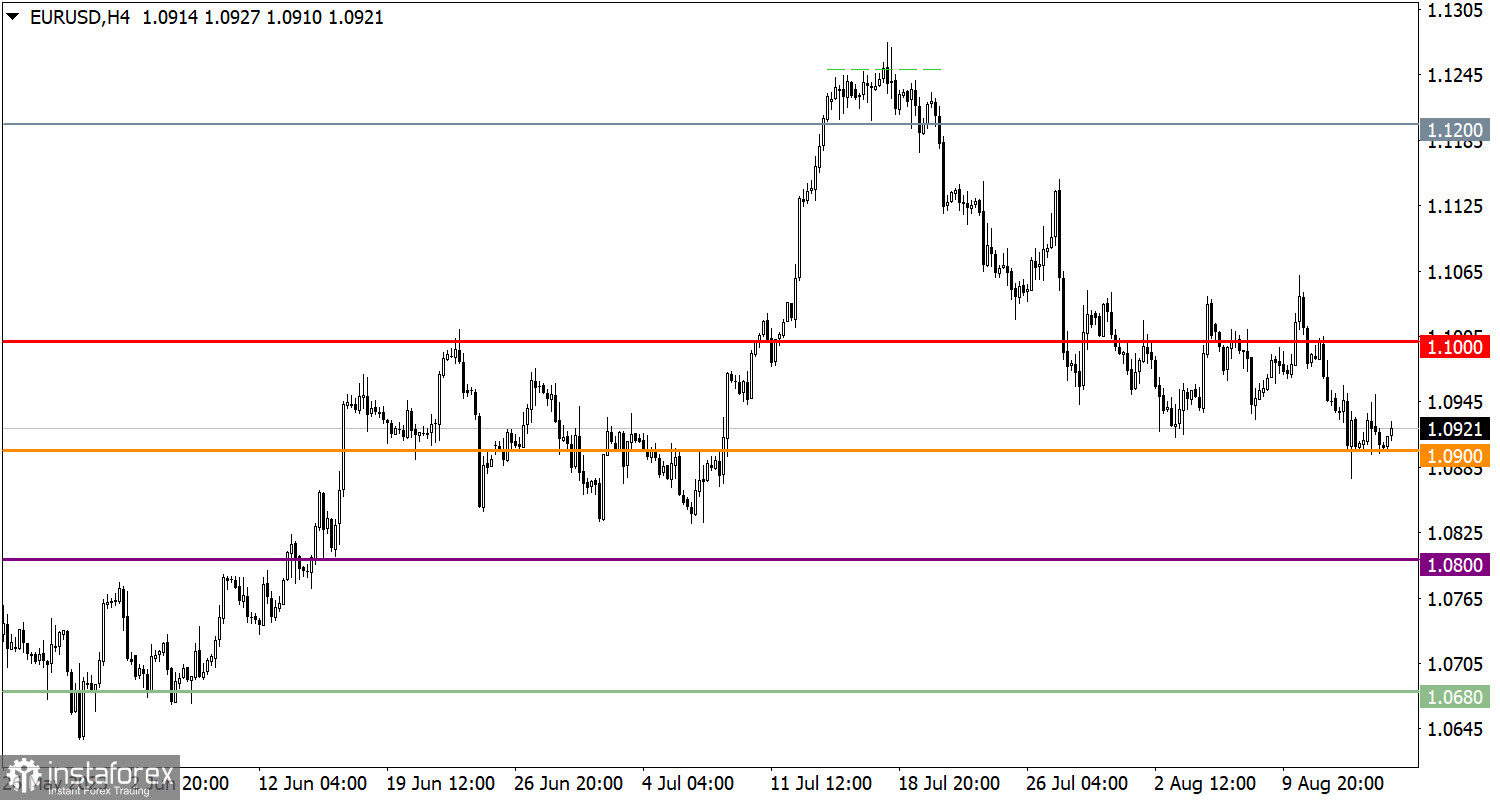
EUR/USD is currently in a state of stagnation near the low of the correction cycle. Sellers find support at the 1.0900 level, where the volume of short positions has decreased.
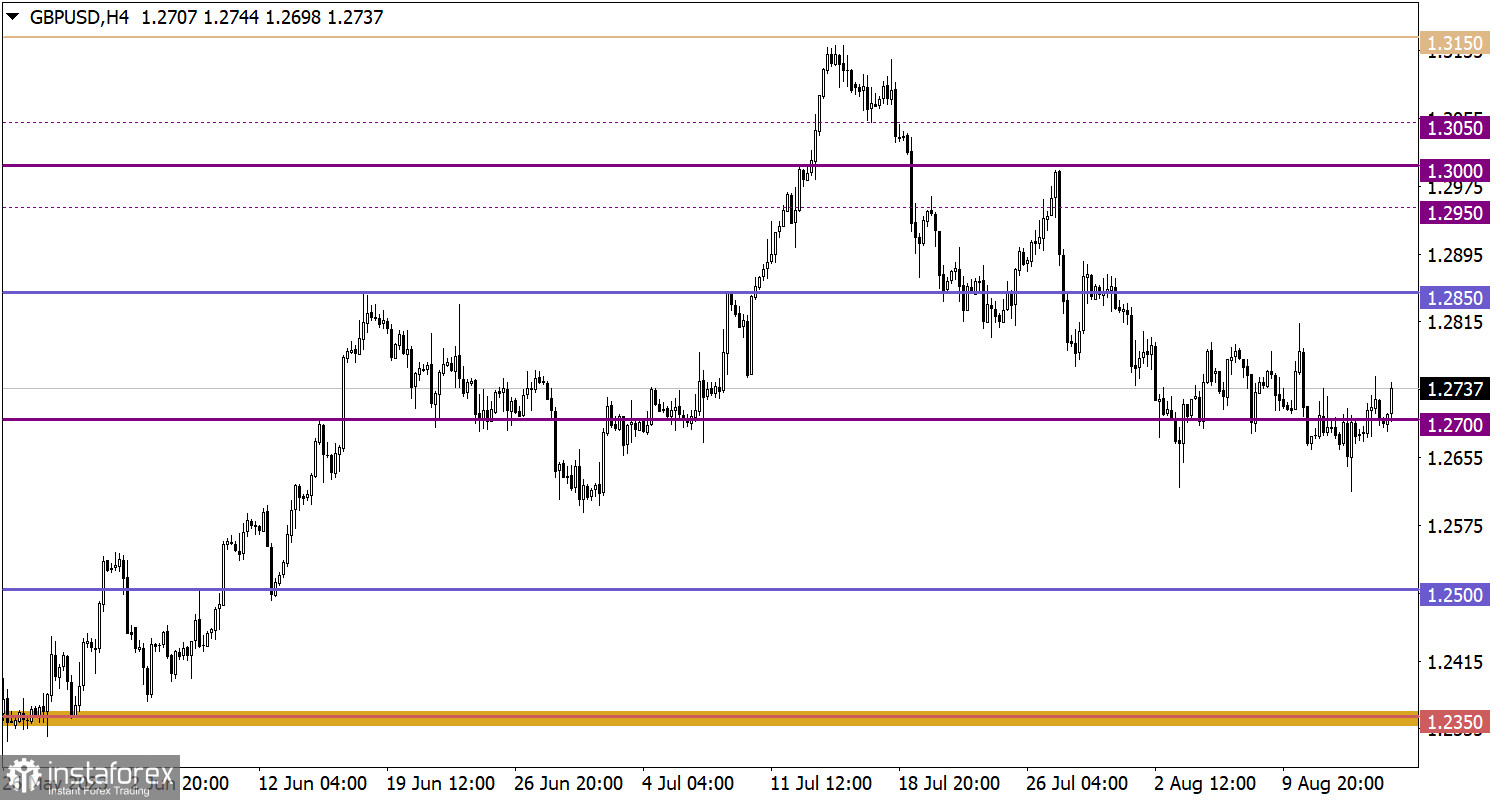
GBP/USD pulled back after updating the local low in August. However, the strengthening of the pound sterling was not too significant, and the volume of long positions decreased near the 1.2700 level, leading to stagnation.

At the opening of the European trading sessions, inflation data in the UK were presented. In July, the inflation rate slowed down and reached 6.8%.
In the European Union and the United States, the publication of industrial production data is expected, where an acceleration of the pace of decline is forecasted.
For a technical signal indicating the continuation of the corrective cycle to emerge, the quote must stay below the level of 1.0900. Otherwise, the current stagnation, occurring near this level, might result in a price rebound.
For the volume of short positions to continue growing, the price must remain stable below the 1.2650 level. In this situation, we can expect a continuation of the current correction cycle. However, it is worth considering an alternative scenario, according to which the current stagnation may lead to fluctuations in the 1.2700/1.2800 area, similar to those already observed earlier.
The candlestick chart type is white and black graphic rectangles with lines above and below. With a detailed analysis of each individual candle, you can see its characteristics relative to a particular time frame: opening price, closing price, intraday high and low.
Horizontal levels are price coordinates, relative to which a price may stop or reverse its trajectory. In the market, these levels are called support and resistance.
Circles and rectangles are highlighted examples where the price reversed in history. This color highlighting indicates horizontal lines that may put pressure on the asset's price in the future.
The up/down arrows are landmarks of the possible price direction in the future.
* Analisis pasaran yang disiarkan di sini adalah bertujuan untuk meningkatkan kesedaran anda, tetapi tidak untuk memberi arahan untuk membuat perdagangan.
Kajian analisis InstaSpot akan membuat anda mengetahui sepenuhnya aliran pasaran! Sebagai pelanggan InstaSpot, anda disediakan sejumlah besar perkhidmatan percuma untuk dagangan yang cekap.


