


Nella nostra squadra ci sono più di 7.000.000 trader! Ogni giorno ci impegniamo a far sì che il trading migliori. Conseguiamo grandi risultati e ci muoviamo in avanti.
Il riconoscimento da parte di milioni di trader in tutto il mondo rappresenta l'alta valutazione della nostra attività! Voi avete fatto la vostra scelta e noi faremo la nostra al fine di soddisfare le vostre aspettative!
Assieme siamo una grande squadra!
InstaSpot. Siamo orgogliosi di lavorare per voi!


Attore, campione del mondo di lotta libera e semplicemente un vero maciste russo! Persona venuta dal nulla. Persona che rispecchia i nostri obiettivi. Il segreto del successo di Taktarov consiste nel mirare continuamente al suo scopo.
Dischiudi anche tu tutti gli aspetti del tuo talento! Impara, prova, sbaglia, ma non fermarti!
InstaSpot - la storia delle tue vittorie inizia qui!

The UK labor market data showed an increase in the unemployment rate to 4.2%, contrary to analysts' forecasts of maintaining the current level at 4.0%. The number of employed people decreased by 66,000 in June, while an increase of 75,000 was expected. Even though these labor market data were not the most favorable, the pound sterling did not show any reaction to them.
During the American trading session, data on retail sales in the United States were published, which turned out to be better than forecasts for July. Analysts expected retail sales growth to slow from 1.5% to 1.0%, but their pace accelerated to 3.2%. This news managed to support the dollar in the market.
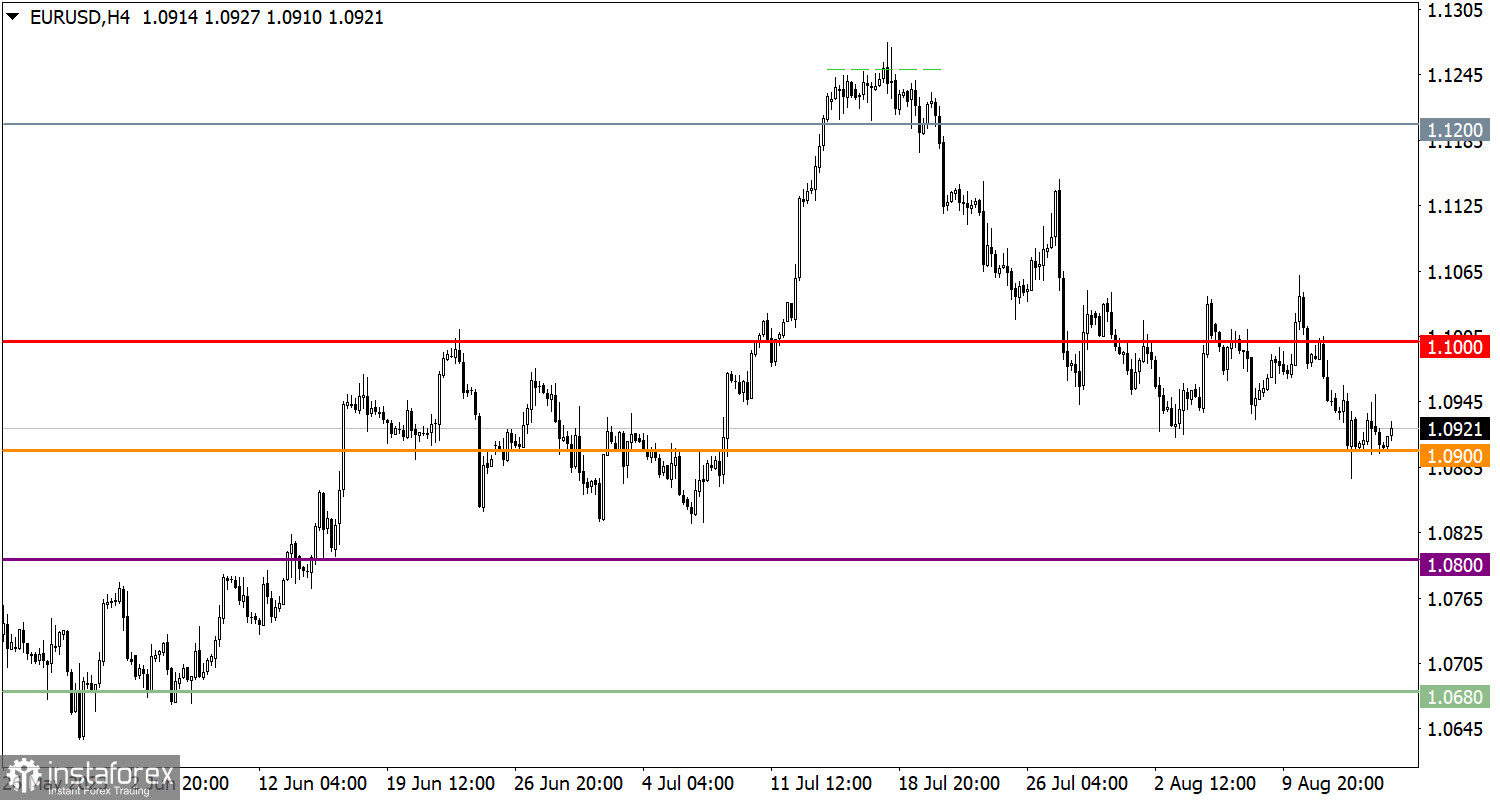
EUR/USD is currently in a state of stagnation near the low of the correction cycle. Sellers find support at the 1.0900 level, where the volume of short positions has decreased.
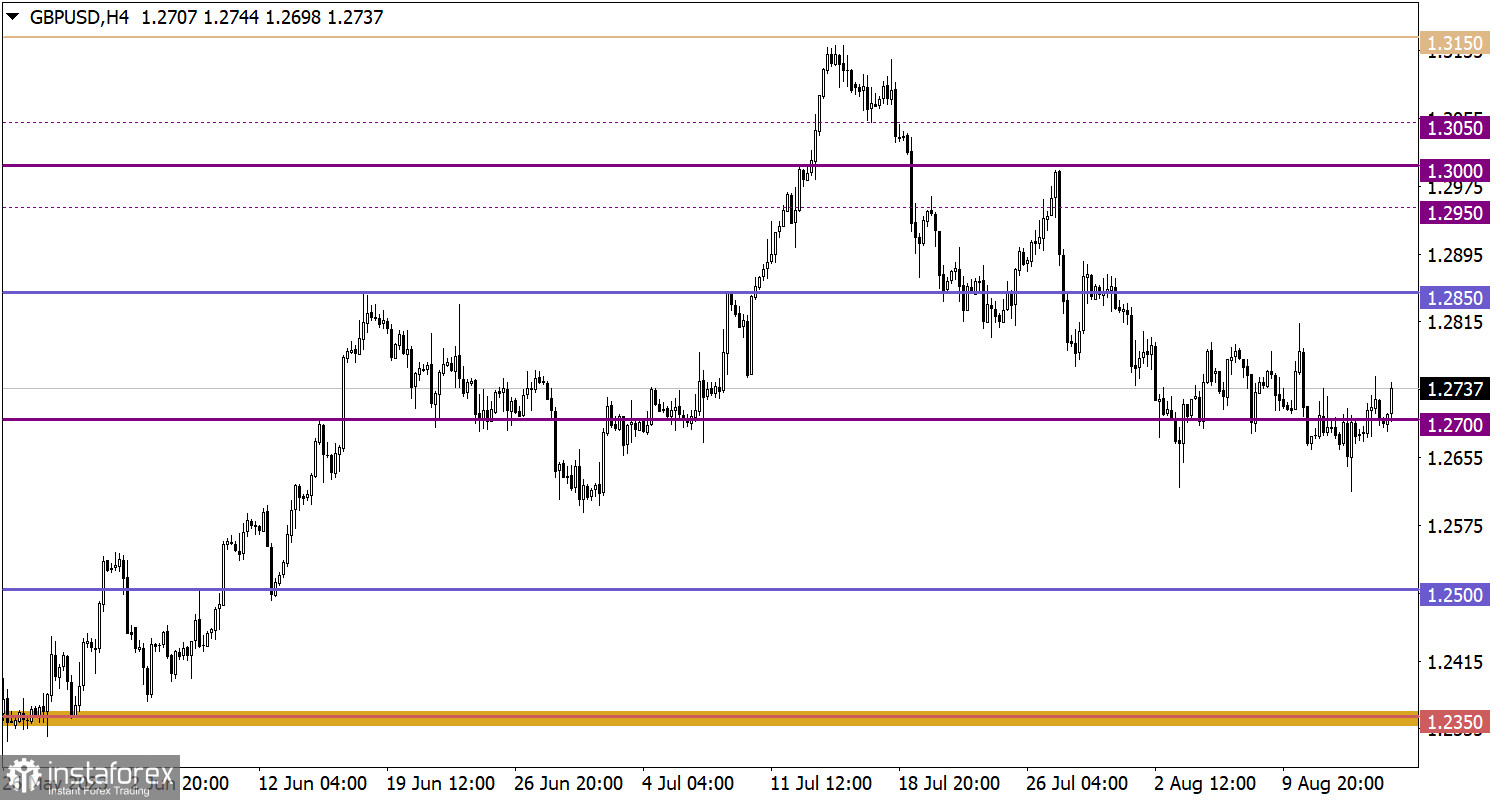
GBP/USD pulled back after updating the local low in August. However, the strengthening of the pound sterling was not too significant, and the volume of long positions decreased near the 1.2700 level, leading to stagnation.
At the opening of the European trading sessions, inflation data in the UK were presented. In July, the inflation rate slowed down and reached 6.8%.
In the European Union and the United States, the publication of industrial production data is expected, where an acceleration of the pace of decline is forecasted.
For a technical signal indicating the continuation of the corrective cycle to emerge, the quote must stay below the level of 1.0900. Otherwise, the current stagnation, occurring near this level, might result in a price rebound.
For the volume of short positions to continue growing, the price must remain stable below the 1.2650 level. In this situation, we can expect a continuation of the current correction cycle. However, it is worth considering an alternative scenario, according to which the current stagnation may lead to fluctuations in the 1.2700/1.2800 area, similar to those already observed earlier.
The candlestick chart type is white and black graphic rectangles with lines above and below. With a detailed analysis of each individual candle, you can see its characteristics relative to a particular time frame: opening price, closing price, intraday high and low.
Horizontal levels are price coordinates, relative to which a price may stop or reverse its trajectory. In the market, these levels are called support and resistance.
Circles and rectangles are highlighted examples where the price reversed in history. This color highlighting indicates horizontal lines that may put pressure on the asset's price in the future.
The up/down arrows are landmarks of the possible price direction in the future.
*La presente analisi del mercato ha un carattere esclusivamente informativo e non rappresenta una guida per l`effettuazione di una transazione.
Le recensioni analitiche di InstaSpot ti renderanno pienamente consapevole delle tendenze del mercato! Essendo un cliente InstaSpot, ti viene fornito un gran numero di servizi gratuiti per il trading efficiente.


