


Legenda dalam pasukan InstaSpot!
Legenda! Anda fikir ia adalah satu retorik yang besar? Tetapi bagaimana untuk kita memanggil seorang lelaki, yang telah menjadi pemain Asia pertama yang memenangi kejohanan catur dunia junior pada usia 18 tahun dan menjadi Grandmaster India pertama pada usia 19 tahun? Itulah permulaan yang sukar untuk merangkul gelaran Juara Dunia untuk Viswanathan Anand, seorang juara yang telah menjadi sebahagian daripada sejarah catur. Kini satu lagi legenda dalam pasukan InstaSpot!


Borussia adalah salah satu kelab bola sepak paling terkemuka di Jerman, yang telah berulang kali membuktikan kepada peminatnya: semangat persaingan dan kepemimpinan pasti akan membawa kepada kejayaan. Berdagang dengan cara yang sama seperti atlet sukan profesional beraksi menentang lawan: yakin dan aktif. Simpan "hantaran" dari Borussia FC dan menjadi pedagang hebat dengan InstaSpot!

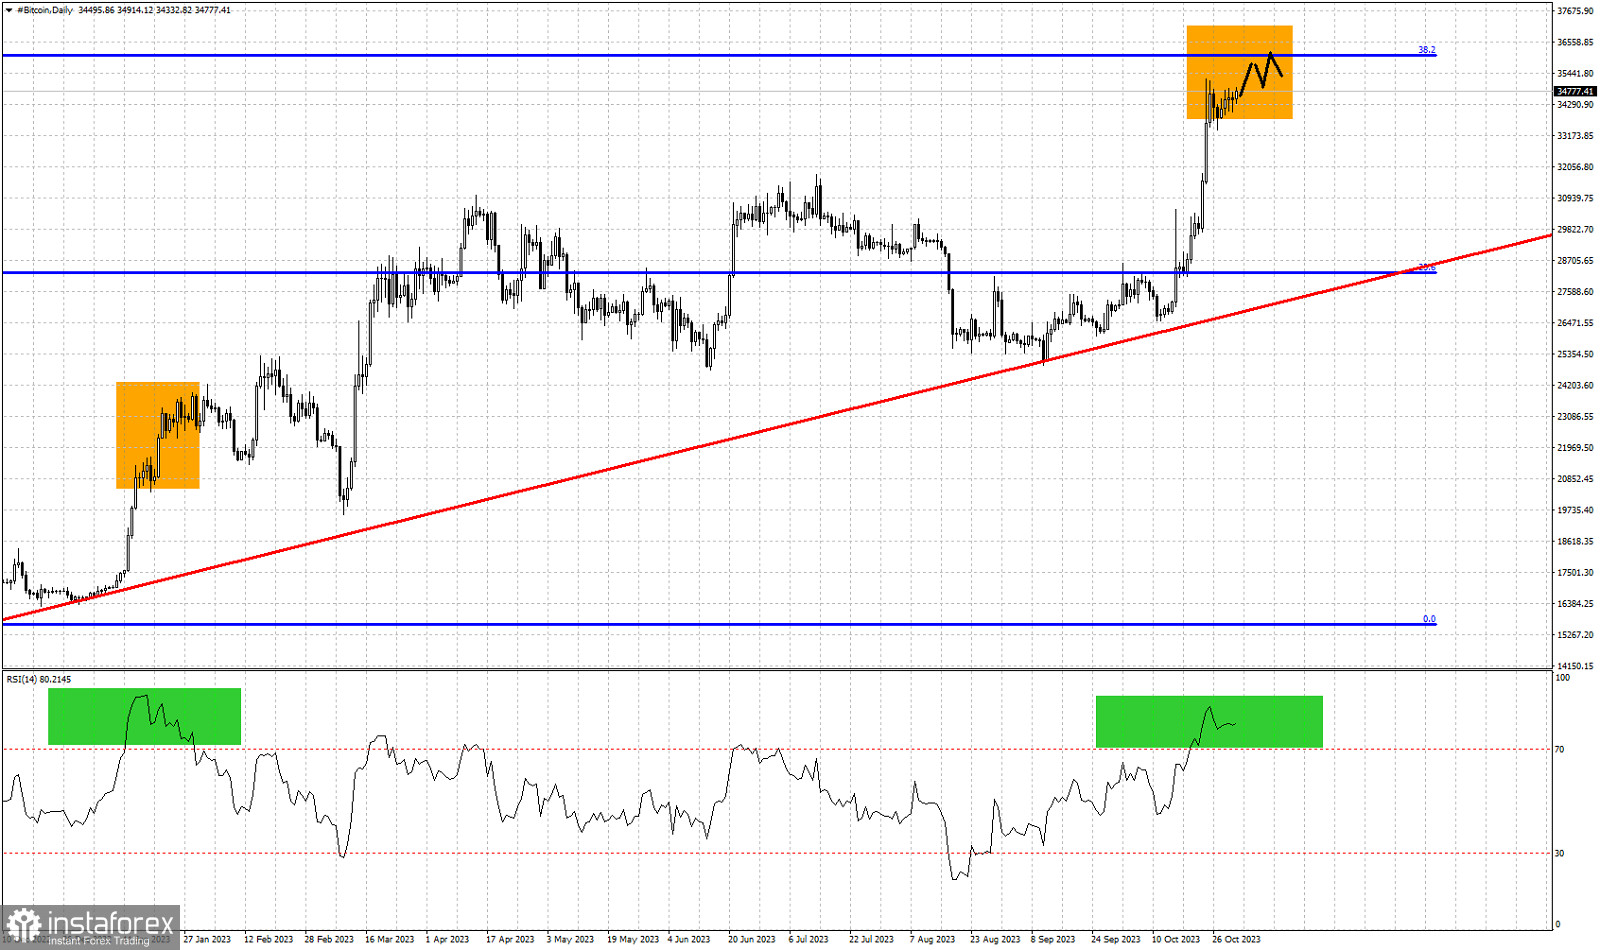
Orange rectangles- similar pattern expected
Green rectangles- overbought levels
Red line- support trend line
Blue lines- Fibonacci retracement levels
Black lines- expected price path
Bitcoin is trading just below the $35,000 price level. Short-term trend remains bullish. The RSI is at overbought levels as we mentioned in a previous analysis. If we follow a similar price path to the one we followed in January when the RSI jumped as high as we are now, then we should expect some more upside. Bitcoin has high chances of reaching the 38% Fibonacci retracement level at $36,125. Although a pull back is justified, we could first see a sequence of short-term higher highs and higher lows before starting a meaningful pull back. Inside the orange rectangle we see how price reacted in January after the RSI reached overbought levels, and we show with black lines what it can do now if history repeats itself.
* Analisis pasaran yang disiarkan di sini adalah bertujuan untuk meningkatkan kesedaran anda, tetapi tidak untuk memberi arahan untuk membuat perdagangan.
Kajian analisis InstaSpot akan membuat anda mengetahui sepenuhnya aliran pasaran! Sebagai pelanggan InstaSpot, anda disediakan sejumlah besar perkhidmatan percuma untuk dagangan yang cekap.


