


Our team has over 7,000,000 traders!
Every day we work together to improve trading. We get high results and move forward.
Recognition by millions of traders all over the world is the best appreciation of our work! You made your choice and we will do everything it takes to meet your expectations!
We are a great team together!
InstaSpot. Proud to work for you!


Actor, UFC 6 tournament champion and a true hero!
The man who made himself. The man that goes our way.
The secret behind Taktarov's success is constant movement towards the goal.
Reveal all the sides of your talent!
Discover, try, fail - but never stop!
InstaSpot. Your success story starts here!

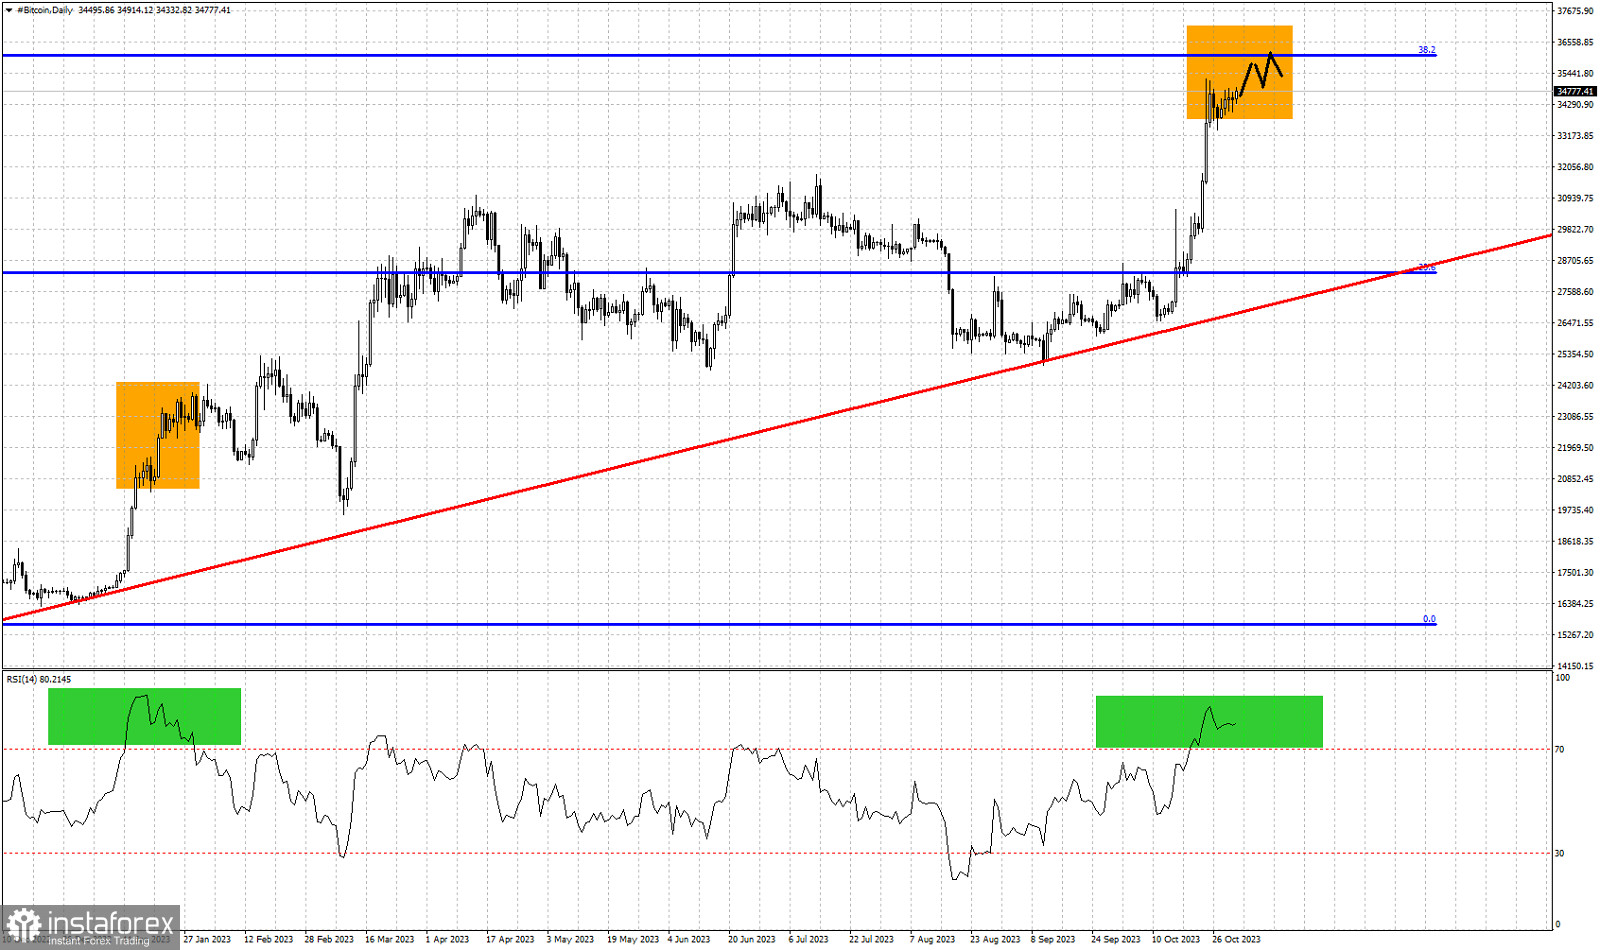
Orange rectangles- similar pattern expected
Green rectangles- overbought levels
Red line- support trend line
Blue lines- Fibonacci retracement levels
Black lines- expected price path
Bitcoin is trading just below the $35,000 price level. Short-term trend remains bullish. The RSI is at overbought levels as we mentioned in a previous analysis. If we follow a similar price path to the one we followed in January when the RSI jumped as high as we are now, then we should expect some more upside. Bitcoin has high chances of reaching the 38% Fibonacci retracement level at $36,125. Although a pull back is justified, we could first see a sequence of short-term higher highs and higher lows before starting a meaningful pull back. Inside the orange rectangle we see how price reacted in January after the RSI reached overbought levels, and we show with black lines what it can do now if history repeats itself.
*এখানে পোস্ট করা মার্কেট বিশ্লেষণ আপনার সচেতনতা বৃদ্ধির জন্য প্রদান করা হয়, ট্রেড করার নির্দেশনা প্রদানের জন্য প্রদান করা হয় না।
ইন্সটাফরেক্স বিশ্লেষণমূলক পর্যালোচনাগুলো আপনাকে মার্কেট প্রবণতা সম্পর্কে পুরোপুরি সচেতন করবে! ইন্সটাফরেক্সের একজন গ্রাহক হওয়ায়, দক্ষ ট্রেডিং এর জন্য আপনাকে অনেক সেবা বিনামূল্যে প্রদান করা হয়।


