


Legenda dalam pasukan InstaSpot!
Legenda! Anda fikir ia adalah satu retorik yang besar? Tetapi bagaimana untuk kita memanggil seorang lelaki, yang telah menjadi pemain Asia pertama yang memenangi kejohanan catur dunia junior pada usia 18 tahun dan menjadi Grandmaster India pertama pada usia 19 tahun? Itulah permulaan yang sukar untuk merangkul gelaran Juara Dunia untuk Viswanathan Anand, seorang juara yang telah menjadi sebahagian daripada sejarah catur. Kini satu lagi legenda dalam pasukan InstaSpot!


Borussia adalah salah satu kelab bola sepak paling terkemuka di Jerman, yang telah berulang kali membuktikan kepada peminatnya: semangat persaingan dan kepemimpinan pasti akan membawa kepada kejayaan. Berdagang dengan cara yang sama seperti atlet sukan profesional beraksi menentang lawan: yakin dan aktif. Simpan "hantaran" dari Borussia FC dan menjadi pedagang hebat dengan InstaSpot!

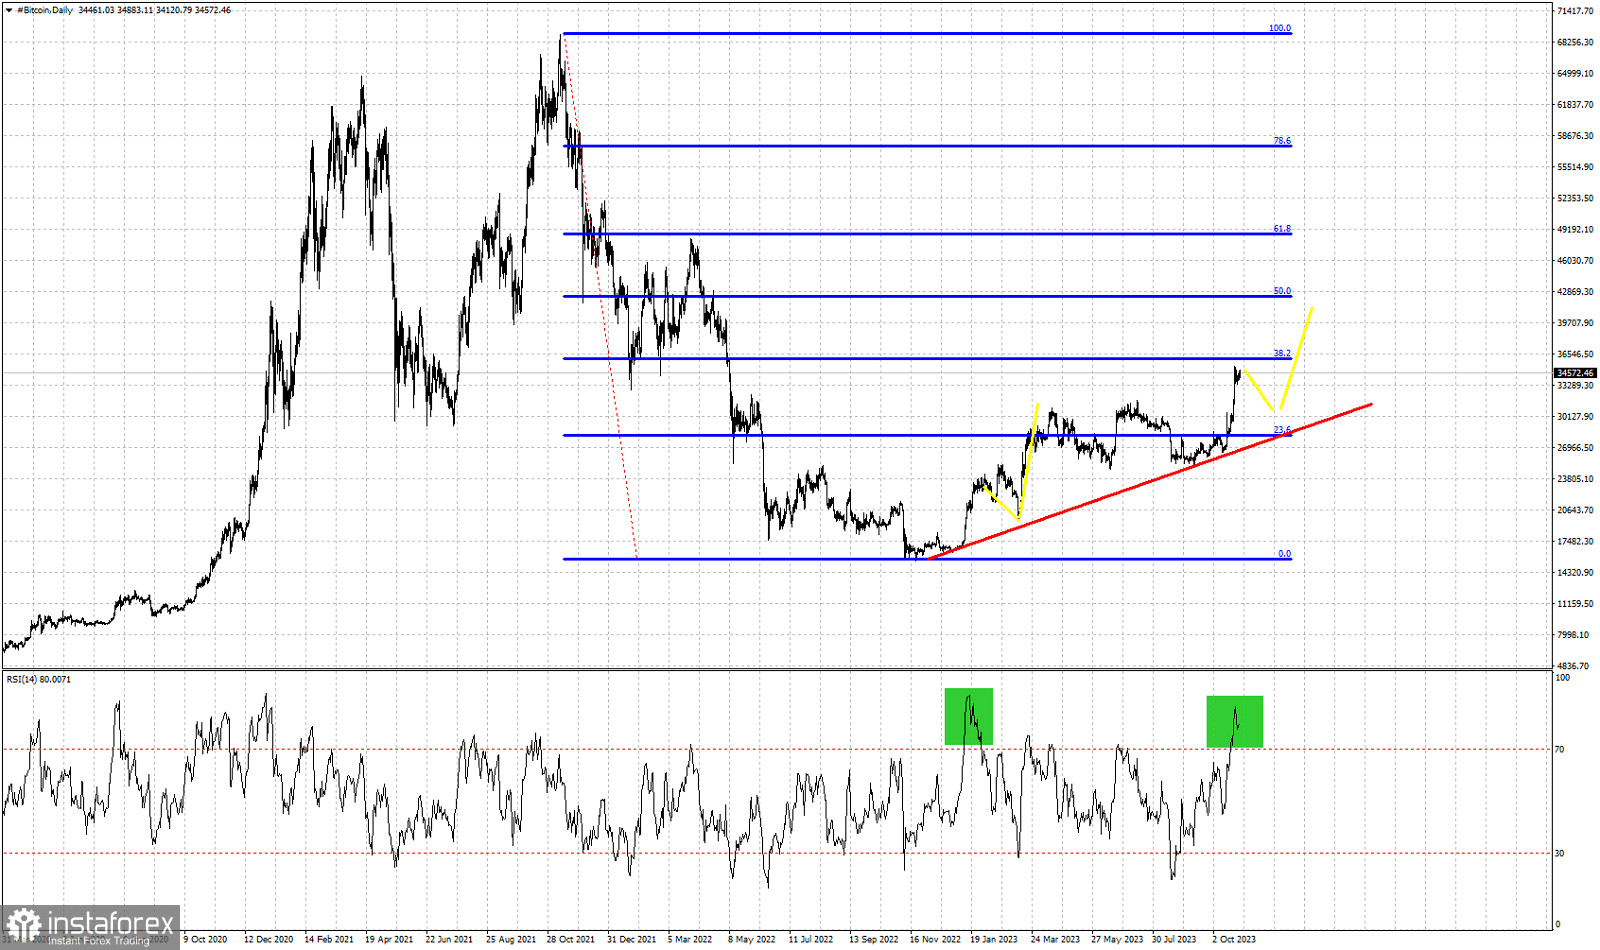
Blue lines- Fibonacci retracement levels
Red line- support trend line
Yellow lines- expected path
green rectangles- overbought spikes in the RSI
Bitcoin is trading around $34,680 just below the 38% Fibonacci retracement of the entire decline from its all time highs. Bitcoin has started making higher highs and higher lows over the last nine months. The RSI is approaching similar overbought levels to the bullish wave that occurred back in January. A pull back followed that provided us with a lower high and another leg higher followed to new higher highs. If the pattern repeats itself, Bitcoin could make a pull back towards $30,000-$31,000 and the red support trend line. A new higher low should form there around these levels and a new wave to the upside should follow. Concluding it is important for bulls to defend the red upward sloping trend line. As long as we trade above it, bulls have the upper hand. In the near term a pull back is justified as the RSI has reached deep inside the overbought area.
* Analisis pasaran yang disiarkan di sini adalah bertujuan untuk meningkatkan kesedaran anda, tetapi tidak untuk memberi arahan untuk membuat perdagangan.
Kajian analisis InstaSpot akan membuat anda mengetahui sepenuhnya aliran pasaran! Sebagai pelanggan InstaSpot, anda disediakan sejumlah besar perkhidmatan percuma untuk dagangan yang cekap.


